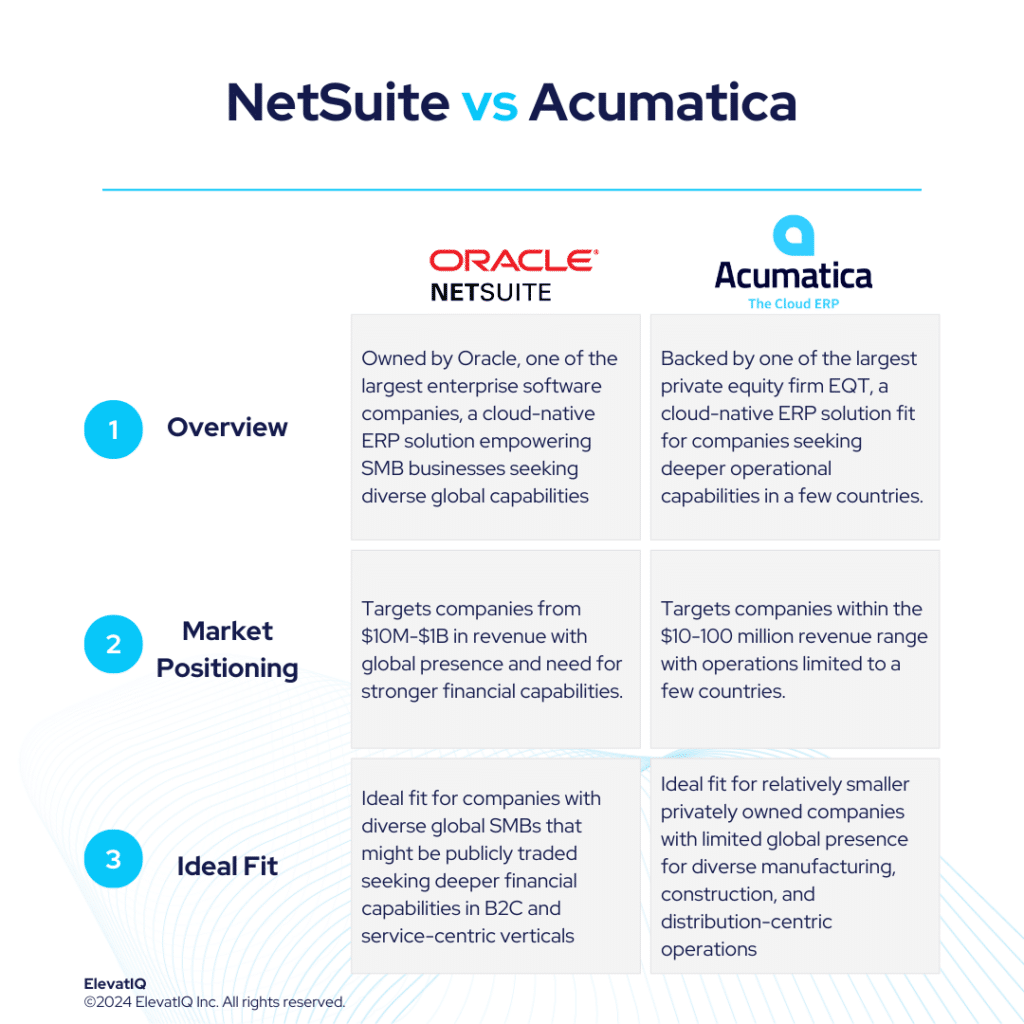
NetSuite and Acumatica are among two of only three cloud-native ERP solutions. NetSuite is ideal for globally spread, small to mid-market companies seeking stronger financial capabilities with localization in many countries than operationally rich solutions for specific business models. Whereas, Acumatica is positioned as an ideal choice for companies within the $10-100 million revenue range, with limited native localization capabilities and synergies for global operations. NetSuite is also an ideal fit for diverse companies ranging from service-centric, distribution-centric, commerce-centric, and B2C organizations. On the other hand, Acumatica excels with its multi-branch capabilities and takes a different approach to supporting diverse business models such as manufacturing, distribution, construction, and field service.
While NetSuite excels across industries, it may not be the ideal choice for industrial distributors and manufacturers due to limited layers with pricing and item master. Its strength lies in supporting lighter manufacturing and consumerized products, particularly health and beauty, fashion, apparel, and CPG. On the contrary, Acumatica is an excellent initial system for companies looking to streamline inventory or costs despite limited capabilities with mature features like dimensional inventory or allocation.
Despite being the best cloud-native options, comparing their capabilities isn’t easy due to their overlap. Although, their marketing materials are likely to come across as very similar, comparing and contrasting requires a deep understanding of their data models. So if you have narrowed down your choices between NetSuite vs Acumatica, this comparison looks under the hood and provides crucial information for your ERP selection project. Let’s dive in?
The 2025 Digital Transformation Report
Thinking of embarking on a ERP journey and looking for a digital transformation report? Want to learn the best practices of digital transformation? Then, you have come to the right place.
NetSuite stands out as the leading ERP solution, driven by its success for diverse industries particularly seeking stronger financial capabilities over the operational, robust ecosystem, credible marketplace add-ons, and comprehensive functionality. Although not as complex as some competitors like SAP S/4 HANA and Microsoft F&O, NetSuite excels in supporting diverse business models, including omnichannel architecture, matrix/dimensional inventory, and subscription-based models.
While NetSuite excels across industries, it may not be the ideal choice for industrial distributors and manufacturers due to limitations in pricing and item master capabilities. Its strength lies in supporting lighter manufacturing and consumerized products particularly health and beauty, fashion, apparel, and CPG. With robust financial capabilities and an integrated HCM solution, NetSuite is well-suited for service-centric industries, including smaller banks, credit unions, financial services, non-profit organizations, as well as the technology and media sectors.
While NetSuite remains the top-ranked solution due to its product quality, there might be challenges with over-customization and integration issues, leading to implementation failures. Thus, working with NetSuite demands thorough vetting of their solution and architecture.
what is Acumatica?
Acumatica is one of three cloud-native ERP solutions similar to NetSuite and Sage Intacct. It has extensive multi-branch capabilities, particularly making it friendlier for retail-centric operations. It can also host multiple business models as part of the same database spanning manufacturing, distribution, construction, and field service. Thus, making it friendlier for diverse manufacturing or distribution-centric operations. Because of its limited global operational capabilities, it primarily targets US and UK-based companies. Thus, positioned as an ideal choice for companies within the $10-100 million revenue range, the majority of Acumatica’s customer base falls under this category.
Desiring a user experience akin to Odoo or Quickbooks, Acumatica ERP also offers versatility to accommodate various business models: distribution, manufacturing, or construction-focused. Although Acumatica has limitations in mature features like dimensional inventory or allocation, it is an excellent initial system for companies looking to streamline inventory or costs. With transactional processing and some mature capabilities, such as batch transactional processing, Acumatica is positioned as a valuable choice for businesses venturing into their first or second ERP solution.
Acumatica ERP is a fit for companies seeking cloud-native experience, particularly emphasizing features like enterprise search and mobility over deeper operational capabilities. Despite its focus on small businesses, Acumatica lacks robust globalization and localization features, catering to a limited number of countries by default. This simplicity, however, benefits smaller companies by avoiding unnecessary layers of multi-entity operations. Although targeting small businesses, Acumatica ERP surpasses Odoo or Zoho with the flexibility of its data layers, necessitating consulting help for implementation. The perceived benefit of Acumatica’s pricing is also a challenge, as it’s notoriously difficult to understand and predict.
NetSuite ERP
Acumatica ERP
Started in
1998
2008
Ownership/Backed by
Oracle in 2016
EQT Partners in 2019
No. of customers
37,000+
10,000+
NetSuite vs Acumatica ERP Comparison
Navigating the choice between NetSuite vs Acumatica is a significant decision for businesses particularly looking for operational efficiency and strategic alignment. Thus, this section delves into the comprehensive comparison of NetSuite vs Acumatica across various critical dimensions.
NetSuite ERP
Acumatica ERP
Global Operational Capabilities
Can handle operations across 200 subsidiaries
Has limited multi-entity capabilities
Diverse Capabilities
Supports diverse business models with operations spanning multiple countries
Accommodates different business models spanning a few countries
Data Layers
Friendlier for B2C and service-centric operations
Richer than Odoo or Zoho, making it a great 1st or 2nd ERP choice
B2B Data Models and Processes
Not friendly for B2B companies as the pricing layers are not scalable as other systems
Attractive for B2B companies with complex customer hierarchies
B2C Data Models and Processes
Attractive for B2C companies because of its ecosystem
Has limited support to support the individual consumer processes and has a weaker ecosystem
Key Features
1. Sales Order Management 2. Sourcing and Procuring 3. Warehouse Management 4. Production Management 5. Accounting
1. General Ledger 2. AR and AP Management 3. Cash Management Integration 4. Tax Management Support 5. Deferred Revenue Accounting 6. Currency Management
Pricing Model
Named-user based
Consumption-based, named, and concurrent
E-Commerce Integrations
Marketplace options prevalent especially integration with omnichannel architecture
Offers native integration with eCommerce operations. Ideal for smaller companies with limited integration and consulting budgets
Manufacturing Capabilities
User feedback has concerns about perceived depth
Non-comprehensive and lacks ownership of key industry features such as quality
Integrated Capabilities
Focuses on seamless CRM integration. Great fit for businesses that are not planning to use a third-party best-of-breed solution
Focuses on its integrated WMS functionality. Great fit for businesses with complex product mixes and deep distribution requirements
Pros of NetSuite vs Acumatica
When evaluating ERP solutions, understanding the distinct advantages of NetSuite vs Acumatica is crucial. In this section, we are particularly exploring the strengths of NetSuite vs Acumatica across various dimensions. Thus, shedding light on their respective capabilities and functionalities.
NetSuite ERP
Acumatica ERP
1. Provides richer financial capabilities over operational, requiring a higher implementation budget than Acumatica
1. Great 1st or 2nd ERP choice due to stronger operational capabilities than NetSuite for industrial verticals
2. Ideal for SMBs operating in different countries
2. Accommodates different business models under one database
3. The data model is B2C friendly, supporting integration with B2C channels
3. The data model is B2B friendly, supporting complex hierarchies and pricing
4. Ideal for eCommerce-centric SMBs because of the ecosystem and the integration operations available for eCommerce-centric companies
4. Consumption-based pricing options reduce costs substantially for certain business models
5. Ideal for companies looking to find best-of-breed software, along with NetSuite core capabilities
5. Superior cloud-native UI experience as Acumatica has a more consistent design throughout application than NetSuite’s legacy and patchy experience, despite both being cloud-native
Cons of NetSuite vs Acumatica
Just like recognizing strengths is important, it’s also crucial to weigh the specific drawbacks of NetSuite vs Acumatica. Therefore, in this section, we will delve into the limitations and challenges associated with NetSuite vs Acumatica across various operational and financial dimensions.
NetSuite ERP
Acumatica ERP
1. Not a great value for companies operating only in a few countries as they can get richer operational capabilities for particularly local operations with ERPs such as Acumatica
1. Limited capabilities when multiple countries with different currencies and sub-ledgers need to be hosted as part of the same solution
2. May struggle with transactional workload requirements of companies over $1B and the ones that might be acquiring 10-20 entities every year
2. Not fit for companies with over $100 million in revenue
3. Not ideal for startups with simpler operating models. They might find audit-centric and deep financial capabilities over-bloated
3. The mobile capabilities are leaner for complex reporting scenarios such as parallel processing or reporting labor
4. Named-user-based pricing requires allocating fixed costs, even for seasonal workers or external users accessing the subset of data such as customer or vendor portals
4. Consumption-based pricing requires consulting expertise to estimate transactions as the pricing is not as predictable
5. Not fit for companies seeking OEM-owned integration with core operational systems such as CAD or PLM
5. Multiple add-ons such as MES, PLM, and quality, posing integration and communication challenges with the core systems required for complex manufacturing
6. The last-mile capabilities required for manufacturing or industrial distribution are extremely limited
6. The last-mile capabilities required for manufacturing or industrial distribution may not as strong as purpose-built solutions such as Infor or Epicor but stronger than NetSuite
Conclusion
Navigating the complexities of NetSuite vs Acumatica requires a comprehensive understanding of the distinct advantages and limitations of each platform. While NetSuite might be a globalized solution suitable for companies seeking diverse global capabilities, it may not be the ideal choice for industrial distributors and manufacturers due to limited data layers. On the other hand, Acumatica shines with its multi-branch capabilities and flexibility to accommodate slightly deeper operational capabilities, making it a preferred option for retail-centric, manufacturing-centric, distribution-centric, and B2B organizations. However, both platforms face challenges with deeper last-mile capabilities that might be available with purpose-built solutions, but they might lead to pigeonholing with specific business models and operations. For this reason, thorough evaluation and consideration of individual business needs are critical before making a decision.
Therefore, engaging with an ERP independent consultant can greatly facilitate the decision-making process by providing expert insights and guidance tailored to the unique requirements of the business and how they align with the core strengths of these two products. Businesses can navigate the complexities of NetSuite vs Acumatica with confidence, also ensuring that they select the most suitable solution to drive operational efficiency and strategic alignment.
FAQs
What are the key differences between NetSuite and Acumatica?
NetSuite and Acumatica, both cloud-native ERP solutions, have distinct strengths tailored to different business needs. NetSuite is renowned for its comprehensive financial capabilities and suitability for diverse industries, including service-centric and B2C organizations. On the other hand, Acumatica excels in multi-branch operations and is favored by companies in the $10-100 million revenue range, particularly those in manufacturing, distribution, construction, and field service sectors. While NetSuite may lack depth in industrial distribution and manufacturing, Acumatica offers flexibility and versatility despite limitations in mature features like dimensional inventory or allocation.
Which businesses are better suited for NetSuite or Acumatica?
Choosing between NetSuite and Acumatica depends on the specific requirements and operational focus of the business. NetSuite is ideal for SMBs operating globally, seeking robust financial capabilities and integration with diverse business models, including B2C operations. It caters well to service-centric industries and supports omnichannel architecture. Conversely, Acumatica targets companies within the $10-100 million revenue range, offering multi-branch capabilities and flexibility across manufacturing, distribution, and other sectors. It suits businesses looking to streamline inventory or costs with transactional processing, although it may lack depth in certain features.
What are the pros and cons of NetSuite compared to Acumatica?
NetSuite has richer financial capabilities and a broader ecosystem, making it suitable for SMBs operating globally and seeking integrated functionalities. However, it may not be the best fit for industrial distributors or manufacturers due to limited pricing and item master capabilities. On the other hand, Acumatica offers versatility and flexibility, particularly for companies with multi-branch operations and manufacturing-centric workflows. While it may lack some mature features, it provides a valuable initial system for businesses looking to streamline inventory or costs.
What is Acumatica ERP? Acumatica is one of three cloud-native ERP solutions similar to NetSuite and Sage Intacct. It has extensive multi-branch capabilities, making it friendlier for retail-centric operations. It can also host multiple business models as part of the same database spanning manufacturing, distribution, construction, and field service. Thus, making it friendlier for diverse manufacturing or distribution-centric operations. Because of its limited global operational capabilities, it primarily targets US and UK-based companies. Positioned as an ideal choice for companies within the $10-100 million revenue range, the majority of Acumatica’s customer base falls under this category.
Desiring a user experience akin to Odoo or Quickbooks, Acumatica ERP offers versatility to accommodate various business models: distribution, manufacturing, or construction-focused. Although Acumatica has limitations in mature features like dimensional inventory or allocation, it is an excellent initial system for companies looking to streamline inventory or costs. With transactional processing and some mature capabilities, such as batch transactional processing, Acumatica is positioned as a valuable choice for businesses venturing into their first or second ERP solution.
Acumatica ERP is a fit for companies seeking cloud-native experience, particularly emphasizing features like enterprise search and mobility over deeper operational capabilities. Despite its focus on small businesses, Acumatica lacks robust globalization and localization features, catering to a limited number of countries by default. This simplicity, however, benefits smaller companies by avoiding unnecessary layers of multi-entity operations. Although targeting small businesses, Acumatica ERP surpasses Odoo or Zoho with the flexibility of its data layers, necessitating consulting help for implementation. The perceived benefit of Acumatica’s pricing is also a challenge, as it’s notoriously difficult to understand and predict.
The 2025 Digital Transformation Report
Thinking of embarking on a ERP journey and looking for a digital transformation report? Want to learn the best practices of digital transformation? Then, you have come to the right place.
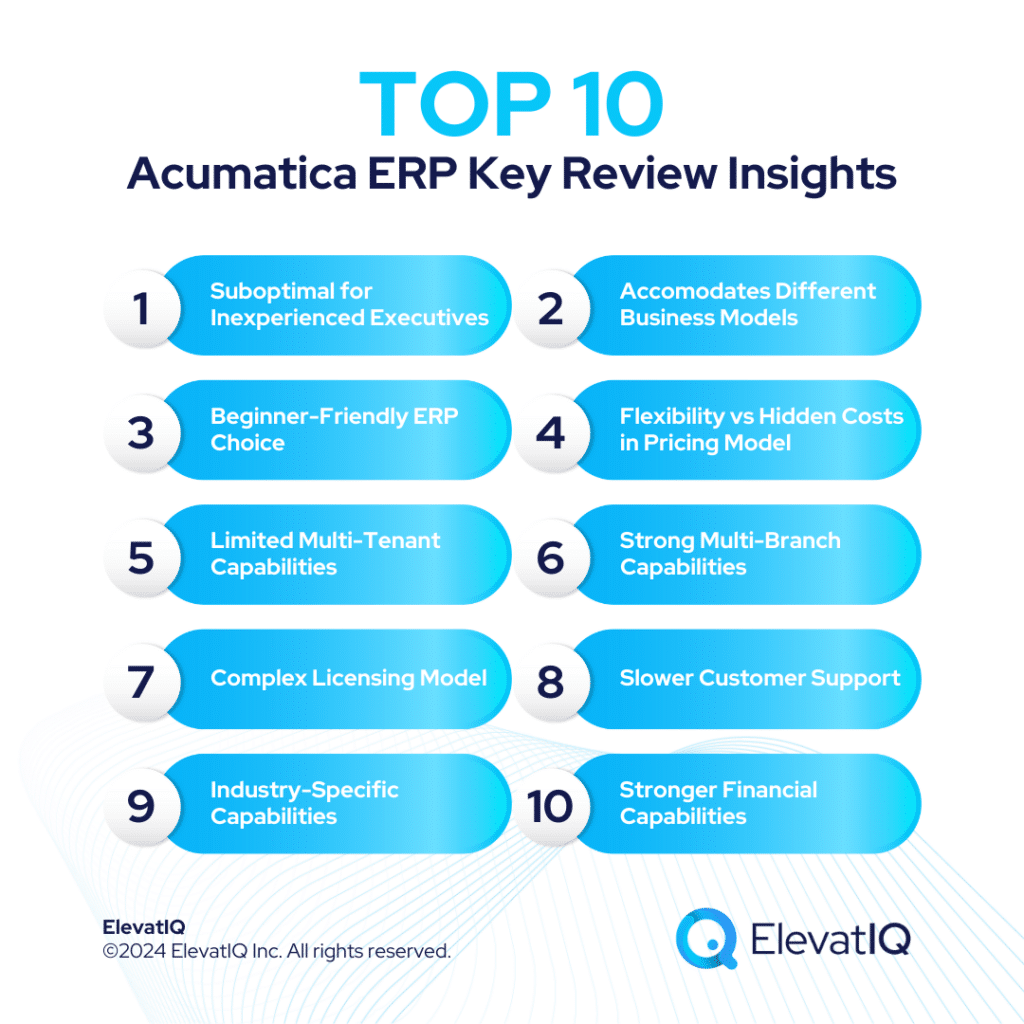
Companies lacking experienced CFOs, operations executives, or controllers particularly, adept in process and data translations for ERP systems may face challenges with Acumatica. Founder-led companies, particularly, might find implementation demanding due to the need for sophisticated skills in translating manual processes. Thus, they might struggle to adapt to Acumatica’s structured data model with intricate business rules for enhanced financial control.
Although Acumatica ERP has limitations in mature features like dimensional inventory or allocation, it is an excellent initial system for companies looking to streamline inventory or costs. With transactional processing and some mature capabilities, such as batch processing, Acumatica is positioned as a valuable choice for businesses venturing into their first or second ERP solution.
4. Flexibility vs Hidden Costs in Pricing Model
Acumatica ERP offers consumption-based pricing and unlimited users. While consumption-based pricing provides flexibility, the unlimited user proposition may entail hidden costs, requiring tier upgrades upon reaching capacity limits. In contrast, Microsoft offers a “true” consumption-based pricing model, enabling businesses to purchase and cancel licenses as required. Although, Acumatica’s unlimited users’ offering would be cost-effective for businesses with seasonal hiring needs or with the need for customer and vendor portals. Businesses should understand their system’s limitations and capacity when considering unlimited users and only grant access to those in need.
Acumatica stands out for its multi-branch capabilities. Thus, making it an ideal choice for companies with a large number of branches within the same country. However, for companies with entities in different countries, Acumatica may struggle, as it is making progress but is not yet as strong as NetSuite or Infor CloudSuite in multi-entity capabilities.
7. Unclear Licensing Model
Acumatica claims to have a consumption-based licensing model but requires yearly contracts, making it inflexible for ad-hoc needs. The tiers also have capacity constraints baked into them, so the claim of unlimited users might be true on paper. But user growth would require upgrading tiers, making the claims of unlimited users merely a financial translation and posing challenges in forecasting true costs of ownership for companies with limited internal experience with IT and system capacity planning.
8. Slower Customer Support
Acumatica’s customer support seemed to be slower than other ERP vendors based on user reviews. However, the local business support provided by Acumatica is contingent on the partners, with Acumatica providing secondary support. Additionally, the 100% channel-driven model means that the partners serve as the first point of contact for support. Despite Acumatica’s strong educational program for partners, there can be pros and cons to this approach, as Acumatica does not own or control its partners’ businesses.
9. Industry-Specific Capabilities
Acumatica is known for its focus on the construction and distribution industries, particularly having relatively stronger capabilities in WMS and housing solutions. However, its manufacturing capabilities are still considered lean, requiring add-ons for critical capabilities such as quality.
10. Stronger Financial Capabilities
The deep capabilities of Acumatica ERP, particularly in areas such as deferred revenue accounting and project-based manufacturing, are especially useful for software businesses and service-centric companies with complex financial requirements, which Acumatica excels at addressing due to its deep financial solution.
11. Embedded Field Service Capabilities
Acumatica’s field services capabilities are not as embedded in other solutions. Thus, making it a strong choice for businesses with significant field service needs alongside distribution or franchises.
12. Integrated WMS Functionality
Acumatica’s capabilities in distribution ERP, specifically focusing on its integrated WMS functionality, is a great fit for businesses with complex product mixes and deep distribution requirements, unlike NetSuite or Business Central, which may require additional add-ons for similar features. Acumatica offers unique features such as cross-references between internal customer and vendor items, centralized distribution and replenishment, and support for non-stock items and complex pricing and discount policies. Additionally, its WMS functionality includes capabilities like matrix inventory, defined bins, use of cards for picking and putaway, and default locations for inventory transactions. Acumatica is particularly well-designed for fashion verticals and retail-centric businesses, rather than complex manufacturing businesses, where distribution-centric features like automated replenishment and seasonality accommodations are crucial.
13. Non-Comprehensive Manufacturing Capabilities
In manufacturing, Acumatica has decent functionality but is not as comprehensive as some hybrid manufacturing solutions and lacks ownership of key industry features such as quality. Acumatica’s pre-assigned serial numbers for traceability in manufacturing are notable features, but the lack of ownership of the quality module raises questions about its usefulness for complex operations.
Acumatica’s data model is especially attractive for B2B companies with complex customer hierarchies, such as buying groups, vendor catalogs, B2B pricing, and branch accounting for inventory reconciliation across channels.
Key Features of Acumatica ERP
General ledger function efficiently monitors and records all financial transactions within a business. Also, aiding in the creation of comprehensive financial statements like income statements and balance sheets. Users can tailor the general ledger by structuring accounts and subaccounts.
Accounts receivable management simplifies invoicing processes by generating and dispatching invoices for outstanding payments. Also, with formatting options including print, PDF, or HTML. This feature supports PCI-compliant credit card transactions, managing refunds, voided transactions, and manual charges. It can also link to bank processing centers via built-in plugins.
Accounts payable function includes advanced prepayment tools for efficient management of requests, application of prepayments to incoming invoices, and issuance of prepayments. The program automates the calculation of use and VAT taxes. Thus, seamlessly generating tax filing reports. Also, aligning payments with cash flows helps reduce the risk of late charges.
Cash management integration seamlessly connects with GL, AR, and AP functions for comprehensive cash management. Balances are updated, and transactions linked to vendors and customers are recorded directly through accounts payable or receivable. Also, the program facilitates fund transfers between accounts and supports transactions in multiple currencies.
Currency management automatically calculates realized gains and losses from foreign currency transactions. It also adjusts unrealized gains and losses and generates auto-reversing entries for open documents recorded in a foreign currency. Also, adhering to FASB-52 standards for currency translation to ensure accuracy and compliance.
Tax management support covers a range of taxes, including use, sales, withholding, VAT, and reverse VAT taxes. Taxes are automatically calculated based on assigned tax zones or categories, also with flexibility for manual adjustments within the system. Additionally, taxes are systematically posted to a designated tax liability account in the general ledger.
Deferred revenue accounting is automated using user-established schedules. Acumatica allows users to create schedules from templates or build them from scratch. Also, seamlessly posting deferred revenue to various financial statements, ensuring accurate and efficient management of deferred revenue accounting processes.
Pros and Cons of Acumatica ERP
Pros
Cons
1. Great 1st or 2nd ERP.Acumatica’s data layers are richer than entry-level accounting or ERP systems such as Odoo or Zoho.
1. Limited Global Capabilities. Limited product architecture when multiple countries with different currencies and sub-ledgers need to be hosted as part of the same solution.
2. Accommodates Different Business Models. As part of the same database.
3. B2B Manufacturing Products. Its data model is friendly for B2B businesses, also with support for complex customer hierarchies and pricing.
3. Limited Mobile Reporting Capabilities. The mobile capabilities are leaner for complex reporting scenarios such as parallel processing or reporting labor or machines separately from the same work center.
4. Cloud-native UI. Superior experience for teams using ERP primarily on mobile devices.
4. Pricing Might be Harder to Predict with Growth. Consumption-based pricing requires consulting expertise to estimate transactions as the pricing is not predictable.
5.Flexible Pricing Options. Consumption-based pricing options reduce costs substantially for certain business models, such as seasonal businesses with labor spikes.
5. Multiple Add-ons may be Required for Regulated Industries and Complex Manufacturing. Such as MES, PLM, and quality, posing integration and communication challenges.
6. Deep Financial Capabilities. Including deferred revenue accounting and project-based manufacturing.
6. Limited Mature Last Mile Capabilities. Although a vibrant marketplace may augment its core capabilities, the last-mile capabilities required for manufacturing or industrial distribution might be limited.
Conclusion
In conclusion, Acumatica ERP offers a compelling option for businesses seeking a flexible and scalable cloud-native ERP solution. However, to make an informed decision, businesses must carefully assess their specific needs. And consider factors such as industry focus, cost implications, and potential complexities. The platform’s strengths and weaknesses reveal particularly a nuanced landscape. Hence, customization and industry fit play pivotal roles in determining its suitability for diverse business models. This Acumatica ERP independent review intends to provide you with unbiased insights for further discussion with your independent ERP consultants.
+
ERP Implementation Failure Recovery
Learn how Frederick Wildman struggled with Microsoft Dynamics 365 ERP implementation failure even after spending over $5M and what options they had for recovery.
What makes Acumatica ERP stand out among other cloud-native solutions like NetSuite and Sage Intacct?
Acumatica ERP distinguishes itself with its extensive multi-branch capabilities, making it particularly suitable for retail-centric operations. Unlike its counterparts, it can host multiple business models within the same database, spanning industries such as manufacturing, distribution, construction, and field service. Additionally, Acumatica is tailored for companies in the $10-100 million revenue range, catering to a specific market segment seeking comprehensive yet scalable ERP solutions.
How does Acumatica ERP address the needs of businesses with diverse operations or undergoing M&A activities?
Acumatica ERP offers versatility to accommodate various business models, including distribution, manufacturing, or construction-focused operations. Despite limitations in mature features such as dimensional inventory or allocation, Acumatica serves as an excellent initial ERP system for companies aiming to streamline inventory or costs. With transactional processing capabilities and features like batch processing, Acumatica is positioned as a valuable choice for businesses embarking on their ERP journey.
What are the considerations regarding pricing and scalability when opting for Acumatica ERP?
Acumatica ERP adopts a consumption-based pricing model with unlimited user propositions. While this offers flexibility, businesses should be aware of potential hidden costs, particularly regarding tier upgrades upon reaching capacity limits. Understanding the system’s limitations and capacity is crucial for accurate cost forecasting, especially for companies with limited internal IT expertise. Additionally, businesses with seasonal hiring needs or requiring customer and vendor portals may find the unlimited user offering cost-effective, but careful evaluation of usage patterns is recommended.
Effective software testing is not just a practice; it’s an absolute necessity. A single disruption within an ERP framework has the potential to bring down an entire business. The stakes are high. Therefore, the key to preventing such disruptions lies in the planning and executing of a robust ERP testing plan. Whether you are navigating the complexities of different ERP testing phases, a well-structured ERP testing plan is your ultimate solution. Thus, ultimately minimizing downtime and maximizing overall efficiency.
Regardless, building an ERP test plan is hard. Executing is even harder. And if you are building a test plan for ERP implementation, you have added challenges. The testing challenges are unique with ERP implementation. This is because users don’t have as much experience with the software development life cycle. They struggle with thinking like a tester, where planning for edge and boundary cases is essential. Thus, ensuring that you won’t find any surprises post your go-live. But how to build a successful ERP test plan for an ERP implementation without issues?
Before we discuss the ERP testing best practices, let’s quickly have a look at its definition and different ERP testing phases. The reason is that there are a few misconceptions regarding ERP test cases. Which is, it being generalized and having faulty designs as part of the ERP testing plan. To tackle these challenges, you must understand the fundamentals first.
What is ERP Testing?
ERP testing plays a crucial role in verifying the effective operation of the ERP system. This comprehensive testing encompasses various phases, including unit testing, integration, system and user acceptance (UAT) testing. The primary objective of ERP testing is to guarantee that the platform functions according to expectations. Therefore, eliminating any potential issues that could impede the organization’s performance. Moreover, consistent ERP testing serves as a vigilant monitoring and control mechanism. It assesses the platform’s efficiency by identifying errors and areas for improvement. Timely detection of issues and their prompt resolution is essential for ensuring the seamless functioning of organizational operations.
Phases of ERP Testing
When we talk about ERP testing, it is pertinent to understand that there are different phases of ERP testing. Let’s review each.
1. Unit Testing
The first phase in the ERP testing process is unit testing. Individual modules or components of the ERP system are rigorously examined for functionality and logic. In this phase, developers or the technical team utilize tools to conduct tests on isolated modules. The primary objective is to ensure that each unit of the ERP system performs as intended. This is achieved by addressing potential issues at the granular level. By validating the functionality of individual components, organizations lay a solid foundation for the subsequent testing phases. In turn, minimizing the risk of inherent defects that could propagate to the integrated system.
2. Integration Testing
Following unit testing is the integration testing phase. This phase focuses on testing the interactions and dependencies between different modules or components of the ERP system. Testers or the functional team employ tools to assess the seamless integration of various system elements. The primary objective is to identify and rectify any issues that may arise when different modules interact. Integration testing ensures that data flows cohesively between different components and that the integrated system operates as a unified whole. This phase is crucial for detecting integration-related challenges early in the testing process. Also, contributing to the overall reliability and stability of the ERP system.
3. System Testing
System testing constitutes the third phase in the ERP testing process. It involves the examination of the entire ERP system as a cohesive unit. Testers or the quality assurance team conduct comprehensive tests for performance, security, usability, reliability, and compatibility. The objective is to ensure that the ERP system meets specified requirements and functions optimally in a real-world scenario. System testing provides a holistic evaluation of the system’s performance. It identifies potential bottlenecks, vulnerabilities, or compatibility issues that may arise in an integrated environment.
4. User Acceptance Testing (UAT)
The final phase of ERP testing is user acceptance testing (UAT). This is where end-users or stakeholders actively participate in evaluating the ERP system for its suitability and satisfaction. The primary goal of UAT is to validate that the ERP system aligns with business requirements. Also, to ensure that the system meets the expectations of end-users. By involving end-users in the testing process, organizations ensure that the system is user-friendly and capable of supporting operational needs. UAT serves as the last line of defense before system deployment. It provides valuable insights into user satisfaction. And, also identifies any critical issues that may impact the system’s usability in a real-world context.
The 2025 Digital Transformation Report
Thinking of embarking on a ERP journey and looking for a digital transformation report? Want to learn the best practices of digital transformation? Then, you have come to the right place.
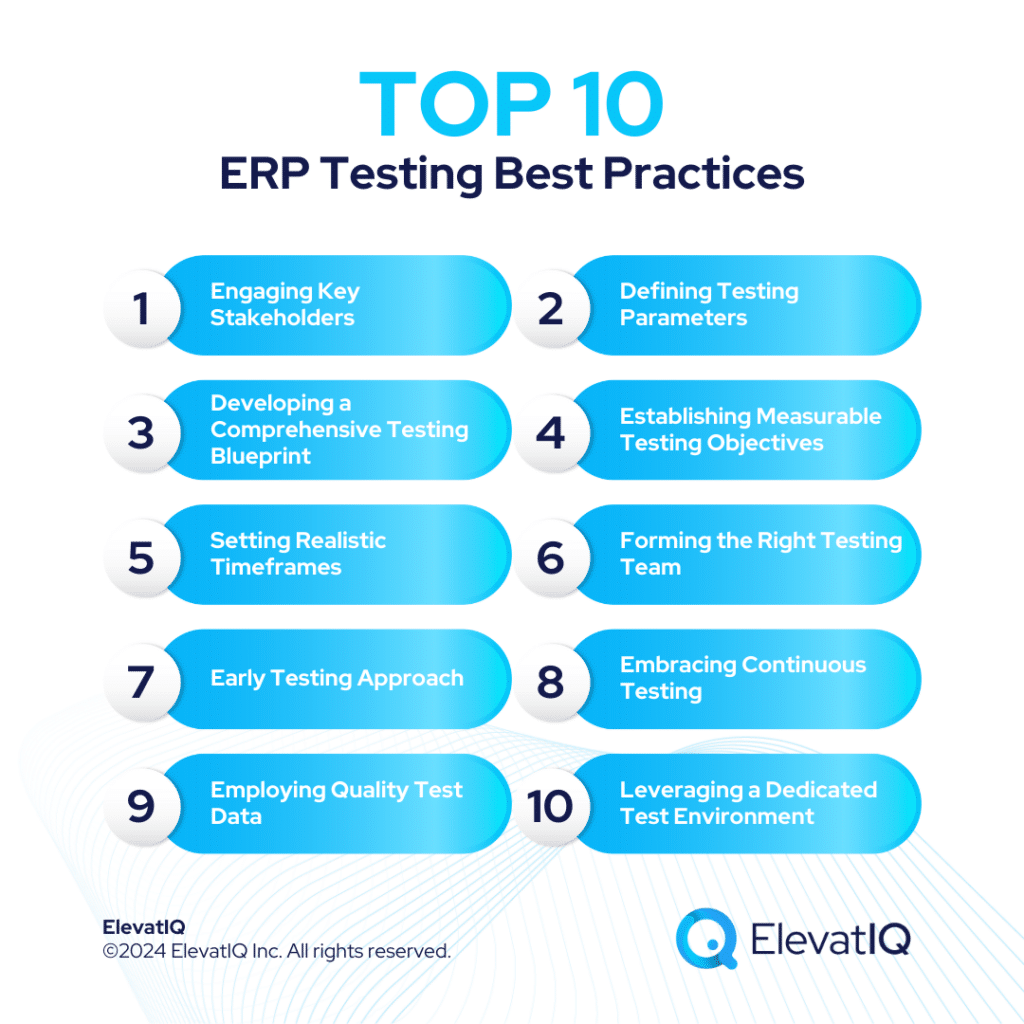
Ensuring the success of ERP testing begins with engaging key stakeholders across the organization. Collaboration from upper management, development teams, and end users conducting user acceptance testing (UAT) is essential. By fostering an inclusive testing environment, organizations can harness the diverse perspectives and expertise necessary for a comprehensive evaluation of the ERP system’s functionality. No-code test automation serves as a game-changer, democratizing the testing process and allowing anyone within the organization to contribute, irrespective of their coding proficiency.
2. Defining Testing Parameters
The foundation of a robust ERP testing plan lies in a clear understanding of the business processes and integrations that need evaluation. Organizations must meticulously define testing parameters to prevent both over-testing and under-testing. By conducting a thorough examination of current processes and integrations, organizations can develop a targeted testing strategy, enhancing the accuracy and efficiency of the entire testing process. This step is crucial in aligning testing efforts with organizational goals and ensuring a focused and purposeful testing approach.
3. Developing a Comprehensive Testing Blueprint
Creating a detailed testing plan is paramount in ensuring alignment on testing priorities among all stakeholders. A comprehensive testing blueprint acts as a roadmap, providing visibility into the testing process for all team members. By fostering transparency and clarity, organizations can mitigate misunderstandings and streamline the testing workflow. This ensures that every aspect of the ERP system is evaluated systematically, contributing to the overall success of the testing plan.
4. Establishing Measurable Testing Objectives
To monitor testing progress effectively, organizations must establish KPIs that are specific and measurable. These objectives serve as benchmarks, allowing teams to gauge their progress and adjust their strategies accordingly. By defining measurable testing objectives, organizations can quantify the success of the testing plan, enabling continuous improvement and refinement of testing processes. This data-driven approach ensures that testing efforts align with broader organizational goals and contribute to the overall success of the ERP implementation.
5. Setting Realistic Timeframes
Setting realistic timelines is crucial for the success of any ERP testing plan. The size and complexity of ERP systems vary, and organizations must be aware of relevant update cycles and business deadlines. By carefully considering these factors, organizations can develop a thorough and achievable testing timeline. This not only prevents rushed testing, which can lead to oversights, but also ensures that the testing plan aligns with broader business objectives. Realistic timeframes contribute to the overall efficiency and success of the ERP testing process.
6. Forming the Right Testing Team
Ensuring the composition of a well-balanced ERP testing team is critical for the effectiveness of the testing process. This team should consist of diverse members, including business leaders, developers, QA engineers, and business users, each with a clear understanding of their roles and responsibilities. Collaborative efforts from various perspectives contribute to a comprehensive evaluation of the ERP system, uncovering potential issues from different viewpoints. Clear communication channels within the team enhance efficiency, enabling timely completion of testing deliverables and promoting a unified approach to achieving testing goals.
7. Early Testing Approach
Adopting a shift-left testing approach is pivotal for addressing potential issues early in the development process, preventing bottlenecks, and ensuring a more efficient ERP testing lifecycle. By shifting testing activities closer to the beginning of the development cycle, organizations can identify and rectify issues at their nascent stages, reducing the likelihood of these issues escalating into critical problems later on. Early testing promotes a proactive mindset, allowing teams to address concerns promptly and maintain the overall integrity of the ERP system throughout its development and implementation.
8. Embracing Continuous Testing
Continuous testing is integral to ensuring the consistent optimal performance of an ERP system. This approach involves testing throughout the development lifecycle, from initial stages to post-implementation, to detect and rectify bugs before they evolve into significant issues. Embracing continuous testing minimizes the risk of overlooking potential problems, as testing becomes an ongoing, integral part of the development process. This iterative approach contributes to the overall stability and reliability of the ERP system, allowing organizations to adapt quickly to changing business needs and technologies.
9. Employing Quality Test Data:
The reliability of ERP test results is contingent upon the quality of test data utilized. Organizations should leverage data from user surveys, performance audits, or automated test data management tools like Opkey. Quality test data ensures that the testing environment closely mirrors real-world scenarios, enhancing the accuracy and relevance of test results. By employing data that accurately represents the diversity of user interactions and system usage, organizations can identify and address potential issues more effectively, ultimately improving the overall robustness of the ERP system.
10. Leveraging a Dedicated Test Environment:
Using a separate test environment is crucial to reducing the risk of errors during the system launch. This dedicated space provides a secure environment for testing various configurations without jeopardizing the production system. By isolating the testing environment, organizations can conduct thorough evaluations without the fear of disrupting critical business processes. This not only safeguards the integrity of the ERP system but also allows for the identification and resolution of issues before the system goes live, contributing to a more seamless and reliable implementation.
11. Conducting a Thorough Documentation
Comprehensive documentation is a cornerstone of effective ERP testing. Documenting every aspect of the testing process serves multiple purposes – it helps in avoiding oversights, ensures accountability, and provides a valuable learning manual for future testers. Automated test documentation tools are highly recommended for their accuracy and compliance. These tools streamline the documentation process, capturing changes, test scenarios, and results in real-time. This not only facilitates a transparent and well-documented testing process but also aids in knowledge transfer, enabling seamless collaboration among team members and ensuring the continuity of testing standards across different testing phases.
12. Tracking System Changes Systematically
System changes are inevitable in the dynamic landscape of ERP implementations. It is crucial to systematically record and communicate any changes in the ERP system to the testing team. This ensures that new features and bug fixes are thoroughly tested before updates are implemented. Keeping the testing team informed allows for a proactive approach to incorporate necessary testing adjustments, reducing the risk of post-implementation issues. Systematic tracking of changes contributes to the overall stability and reliability of the ERP system, fostering a culture of vigilance and adaptability within the testing process.
13. Maximizing Test Case Libraries
Efficiency in ERP testing can be significantly enhanced by maximizing the use of pre-defined test cases. Utilizing established test cases for ERP systems saves both time and resources, eliminating the need to create tests from scratch. These pre-defined test cases, often based on industry best practices, cover a wide range of scenarios, ensuring comprehensive test coverage. By leveraging existing test case libraries, organizations can streamline the testing process, reducing redundancy, and increasing the overall efficiency of the testing effort. This approach allows testing teams to focus on unique aspects of the ERP system, ensuring a more targeted and effective testing strategy.
14. Allocating Sufficient Time for UAT
User Acceptance Testing (UAT) is a critical phase in the ERP testing plan, and allocating ample time for end users to thoroughly test the system is imperative. UAT provides a real-world validation of the ERP system’s functionality and usability, ensuring that it meets the expectations and requirements of end users. Adequate time allocation for UAT allows for comprehensive testing, feedback gathering, and necessary adjustments before the system is deployed. Prioritizing UAT in the testing plan contributes to the overall success of the ERP implementation by enhancing user satisfaction and minimizing the likelihood of post-implementation issues.
To ensure the stability and functionality of an ERP system, it is crucial to conduct a combination of regression, functional, and integration testing. Regression testing ensures that modifications to the ERP system do not compromise existing functionality. Functional testing validates individual features, ensuring they meet specified requirements. Integration testing focuses on verifying the interactions between different ERP components, ensuring smooth business processes. Adopting a comprehensive approach that includes these testing types contributes to the overall reliability and performance of the ERP system, minimizing the risk of issues arising during or after implementation.
16. Separating Security & Performance Testing
In a robust ERP testing plan, it is essential to conduct security and performance testing in distinct environments. This separation allows for the isolation of the impact of modifications on software functionality, ensuring that security measures are robust without compromising system performance. Security testing identifies vulnerabilities and safeguards against potential breaches, protecting sensitive data and maintaining compliance with industry regulations. Simultaneously, performance testing evaluates the ERP system’s responsiveness, stability, and scalability under varying conditions. By separating these critical testing aspects, organizations can ensure a holistic assessment of the ERP system’s capabilities while addressing specific concerns related to security and performance independently.
17. Ensuring Regulatory Compliance
Adherence to industry-specific compliance protocols is non-negotiable in ERP testing. Failure to comply with regulations can result in significant consequences such as fines and additional development costs. Integrating compliance checks into the testing plan ensures that the ERP system meets the required standards and regulations. This proactive approach not only mitigates legal risks but also fosters a culture of responsible and ethical ERP implementation. By prioritizing regulatory compliance in the testing process, organizations safeguard their reputation, avoid financial penalties, and ensure the longevity of their ERP system in an increasingly regulated business environment.
18. Thoroughly Testing End-to-End Processes
End-to-end testing is a critical component of a comprehensive ERP testing strategy. This form of testing validates the entire system, including software, hardware, and interactions with external systems like third-party accounting or marketing systems. By examining the complete workflow, organizations ensure that all integrated components function seamlessly together. End-to-end testing identifies potential bottlenecks, data flow issues, or compatibility problems that may arise when various elements interact. This holistic approach guarantees that the ERP system performs as intended in a real-world, interconnected business environment, enhancing overall system reliability and user satisfaction.
19. Prioritizing UAT Testing
User Acceptance Testing (UAT) holds a pivotal role in the ERP testing plan as it directly impacts application performance and user adoption rates. UAT involves end users validating the system against their business requirements, ensuring that it meets their operational needs effectively. Prioritizing UAT testing ensures that potential issues identified by end users are addressed before system deployment. This user-centric approach not only enhances the quality of the ERP system but also promotes user satisfaction and acceptance. The success of an ERP implementation often hinges on user buy-in, making UAT a critical phase in the overall testing strategy.
20. Embrace No-Code Testing
In the context of ERP testing, embracing no-code testing proves to be a valuable asset, especially in business environments where end users may lack technical training. No-code testing empowers non-technical employees to contribute actively to the testing process, reducing the dependency on coding expertise. This democratization of testing ensures that individuals with domain knowledge can create and execute tests, providing a more comprehensive evaluation of the ERP system from various perspectives. By embracing no-code testing, organizations tap into a broader pool of contributors, fostering collaboration and inclusivity in the testing process while improving overall testing efficiency.
Conclusion
Crafting a robust ERP testing plan is a multifaceted process that demands meticulous planning, collaboration, and the adoption of best practices. By prioritizing the engagement of key stakeholders, defining testing parameters, and leveraging advanced testing methodologies, organizations can ensure a thorough and efficient evaluation of their ERP systems. Each best practice contributes to the overall success of the ERP testing plan.
Implementing these strategies not only minimizes risks and enhances system reliability but also positions organizations for a seamless and successful ERP system implementation. The careful consideration of these 20 key factors is paramount in achieving a well-rounded ERP testing strategy that meets the dynamic challenges of modern business environments. This list intends to provide you with insights for further discussion with your independent ERP consultants.
+
ERP Implementation Failure Recovery
Learn how Frederick Wildman struggled with Microsoft Dynamics 365 ERP implementation failure even after spending over $5M and what options they had for recovery.
ERP testing is vital for ensuring the effective operation of an ERP system, which, if disrupted, can potentially bring down an entire business. The comprehensive testing process, including unit testing, integration, system testing, and user acceptance testing (UAT), aims to guarantee the platform’s functionality, identify errors, and provide a vigilant monitoring mechanism.
What are the key phases of ERP testing, and why are they important?
Key phases include unit testing, integration testing, system testing, and user acceptance testing (UAT). They are crucial for identifying and fixing issues at different levels, ensuring system reliability and user satisfaction.
How can organizations build a successful ERP testing plan?
To build a successful ERP testing plan, engage key stakeholders, define testing parameters, develop a comprehensive testing blueprint, establish measurable objectives, set realistic timeframes, form a balanced testing team, adopt an early testing approach, embrace continuous testing, use quality test data, employ a dedicated test environment, conduct thorough documentation, track system changes systematically, maximize test case libraries, allocate sufficient time for UAT, and conduct regression, functional, and integration testing.
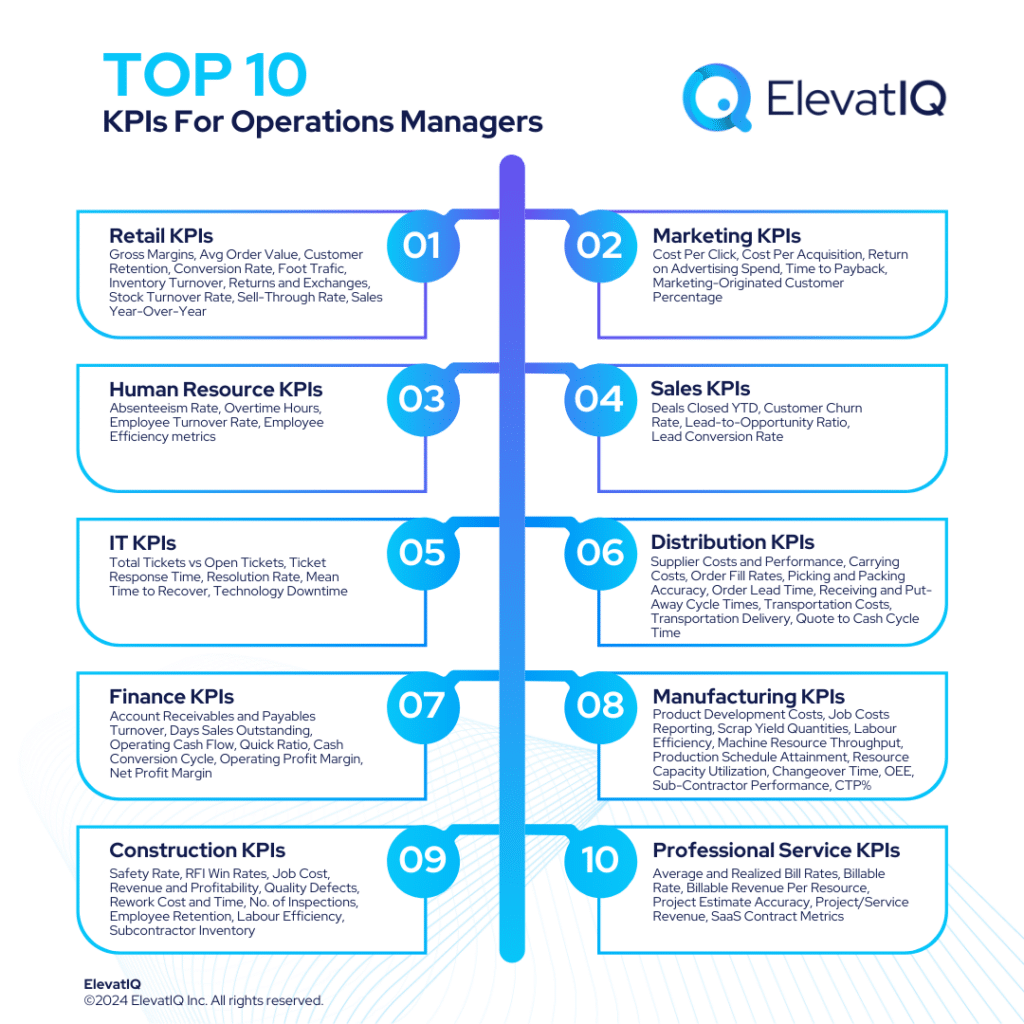
Operations managers are often responsible for all operational business processes from start to finish. From employees to suppliers, projects, jobs, and meetings, they strive to increase productivity, lower costs, and improve the quality of work. Their job is to empower their team of material planners, schedulers, estimators, warehouse workers, field service technicians, consultants, quality managers, maintenance staff, and laborers with relatable information.
The KPIs for operations managers would always differ based on their responsibilities, the size of the organization, and the industry. Operations management could be as diverse as managing tactical roles such as logistics to strategic roles such as procurement or marketing. Despite being so diverse, weak operations management can lead to weak sales and operations planning, which might, in turn, lead to operational disruptions and inferior customer experience. So, which KPIs for operations managers are the most relevant to ensure streamlined operations?
Operations managers are often tasked with harmonizing diverse functions spanning marketing, retail, human resources, sales, distribution, IT, finance, manufacturing, construction, and professional services. Here is the examination of the top 10 KPIs for operations managers based on each company department. This discusses ten departmental KPIs for operations managers: retail, marketing, human resources, sales, IT operations, distribution, finance, manufacturing, construction, and professional service operations KPIs, respectively. These KPIs serve as instruments, finely tuned to provide chaotic insights into the efficient, effective, and overall healthy operational facets.
Retail KPIs For Operations Managers
1. Gross Margins
Gross margins are critical components of retail KPIs for operations managers. It represents the percentage difference between the revenue generated from sales and the cost of goods sold (COGS). This means it measures the profitability of each product or service.
A high gross margin indicates that a significant portion of revenue is retained after covering the production or acquisition costs. Thus, signaling healthy financial performance. On the contrary, a low gross margin suggests that a substantial portion of revenue is consumed by the cost of goods sold, potentially impacting overall profitability.
Formula: Gross Margin Percentage=[(Total Revenue−Cost of Goods Sold)/Total Revenue]×100.
2. Average Order Value
Average order value provides insights into the average amount customers spend per transaction. AOV is calculated by dividing the total revenue generated by the number of orders. This metric is a valuable indicator of consumer purchasing behavior, reflecting the effectiveness of a company’s sales and marketing strategies.
A high AOV suggests that customers are making more valuable transactions, indicating a successful upselling or cross-selling approach. Conversely, a low AOV may signal the need for strategic adjustments to encourage customers to add more items to their carts. Operations managers keen on maximizing revenue and profitability should closely monitor AOV. They can utilize the insights gained to refine sales tactics, enhance customer experience, and optimize pricing strategies.
Formula: AOV= Total Revenue/Number of Orders
3. Customer Retention
Customer retention measures the ability of a business to retain its existing customers over a specific period. This metric is a testament to the loyalty and satisfaction of customers. It reflects the effectiveness of a company’s products, services, and overall customer experience.
A high customer retention rate indicates a strong and loyal customer base, highlighting successful customer relationship management strategies. Conversely, a low retention rate may signal dissatisfaction or a lack of engagement, prompting operations managers to investigate and implement strategies to improve customer satisfaction and loyalty. Armed with this metric, operations managers can proactively shape strategies to enhance customer engagement, foster brand loyalty, and drive sustained business growth.
Formula: Customer Retention Rate = (Number of Customers at End of Period - Number of New Customers Acquired During Period)/ Numbers of Customers at Start of Period
4. Conversion Rate
Conversion rate measures the percentage of website visitors or potential customers who take a desired action, such as making a purchase. It serves as a critical indicator of the effectiveness of a company’s sales and marketing strategies in turning potential customers into actual buyers.
A high conversion rate suggests that a significant portion of visitors is engaged and motivated to complete a transaction, reflecting the success of the company’s efforts in driving customer actions. Conversely, a low conversion rate may indicate inefficiencies or barriers in the customer journey, prompting operations managers to assess and refine the online shopping experience or marketing tactics.
Formula: Conversion Rate = (Number of Conversion/Number of Website Visitors or Potential Customers)×100
5. Foot Traffic and Digital Traffic
These two are essential retail KPIs for operations managers that provide insights into customer engagement across physical and online channels, respectively. Foot traffic refers to the number of visitors to a physical retail store, while digital traffic encompasses the online presence, measuring the number of visitors to a company’s digital platforms. These metrics indicate the level of interest and interaction customers have with the brand in different spaces.
High foot traffic signifies a bustling physical store, indicating popularity and potential sales opportunities. Similarly, high digital traffic suggests a robust online presence, which can translate into increased digital sales and brand visibility. On the flip side, low foot traffic or digital traffic may signal a need for improved marketing strategies, enhanced customer experiences, or adjustments to product offerings.
6. Inventory Turnover
Inventory turnover measures how efficiently a company manages its inventory by evaluating the number of times inventory is sold and replaced within a specific period. It is defined as the ratio of the cost of goods sold (COGS) to the average inventory during that period. This metric serves as a key indicator of inventory management effectiveness, providing insights into how quickly products are moving off the shelves.
A high inventory turnover ratio typically indicates efficient inventory management, swift sales, and minimized holding costs. Conversely, a low inventory turnover suggests slow-moving stock, potential overstocking issues, and increased holding costs. Operations managers can leverage this metric to fine-tune inventory strategies, optimize stock levels, and ensure a healthy balance between product availability and financial efficiency.
Formula: Inventory Turnover = Cost of Goods Sold (COGS)/Average Inventory
7. Returns and Exchanges
Returns and exchanges are integral components of retail KPIs for operations managers. It includes the volume of products customers bring back or exchange within a specified timeframe. This metric is a crucial measure of customer satisfaction, product quality, and overall operational efficiency.
A high rate of returns and exchanges may indicate potential issues such as dissatisfaction, product defects, or discrepancies between customer expectations and delivered goods. Operations managers must scrutinize the reasons behind high return rates to address underlying concerns, optimize product quality, and enhance customer experiences. Conversely, a low rate of returns and exchanges generally signifies customer contentment and operational effectiveness, indicating that products meet or exceed customer expectations.
Formula: Return and Exchange Rate = (Number of Returns and Exchanges/Total Number of Items Sold)×100
8. Stock Turnover Rate
Stock turnover rate is a metric that assesses how efficiently a company manages its inventory by measuring the number of times stock is sold and replaced within a specific period. This KPI is a key indicator of inventory management efficiency, providing insights into how quickly a company can sell and restock its products.
A high stock turnover rate generally indicates efficient inventory management, where products move briskly, reducing holding costs and potential obsolescence. Conversely, a low turnover rate may suggest overstocking or slow-moving inventory, leading to increased holding costs and the risk of product obsolescence. Operations managers can leverage this KPI to make informed decisions about inventory levels, ensuring a balance between meeting customer demand and optimizing operational costs.
Formula: Stock Turnover rate = Cost of Goods Sold (COGS)/Average Inventory Value
The 2025 Digital Transformation Report
Thinking of embarking on a ERP journey and looking for a digital transformation report? Want to learn the best practices of digital transformation? Then, you have come to the right place.
Sell-through rate quantifies the efficiency of a company in selling its inventory over a specific period. Essentially, it gauges how well a business is managing its stock levels and meeting consumer demand.
A high sell-through rate indicates that products are moving off the shelves swiftly, signifying strong consumer interest and effective inventory management. Conversely, a low sell-through rate may suggest that products are lingering in stock, potentially indicating overstocking, pricing issues, or a lack of demand. Operations managers, by closely monitoring sell-through rate, gain valuable insights into inventory performance, enabling them to make data-driven decisions on pricing strategies, product assortment, and overall inventory management for optimal business outcomes.
Formula: Sell-Through Rate = (Number of Units Sold/Beginning Inventory) ×100
10. Sales Year-Over-Year
Sales year-over-year (YoY) is one of the crucial retail KPIs for operation managers that assesses the percentage change in a company’s sales performance for a specific period compared to the same period in the previous year. It provides a longitudinal perspective on sales trends, allowing operations managers to gauge the overall growth or decline in revenue.
A positive YoY indicates sales growth, showcasing the effectiveness of business strategies and market demand. Conversely, a negative YoY suggests a decline in sales, prompting operations managers to investigate the root causes, adapt strategies, and make informed decisions to reverse the trend.
Formula: Sales Year-Over-Year = [(Current Year Sales - Previous Year Sales)/Previous Year Sales] ×100
Marketing KPIs For Operations Managers
11. Cost Per Click
Cost per click measures the average cost incurred by advertisers each time a user clicks on their online ad. CPC serves as a key metric for evaluating the efficiency and cost-effectiveness of online advertising campaigns.
A high CPC may indicate that the cost of acquiring each click is relatively expensive, possibly requiring a reassessment of the advertising strategy or targeting parameters. Conversely, a low CPC suggests that the advertising campaign is cost-efficient, allowing the company to reach a broader audience for a lower investment. Operations managers can leverage this metric to optimize advertising budgets, refine targeting strategies, and ensure that marketing initiatives generate valuable user engagement at an optimal cost.
Formula: CPC = Total Advertising Cost/Number of Clicks
12. Cost Per Acquisition
Cost per acquisition is one of the fundamental marketing KPIs for operations managers, serving as a metric to evaluate the average expense incurred in acquiring a new customer. CPA is a vital indicator of the efficiency and cost-effectiveness of a company’s marketing campaigns and strategies.
A high CPA suggests that acquiring new customers is relatively expensive, possibly indicating inefficiencies in the marketing approach or the need for optimization. Conversely, a low CPA reflects a more cost-effective strategy for attracting new customers. Monitoring CPA allows operations managers to assess marketing efforts’ return on investment (ROI), guiding strategic decisions and resource allocations to optimize customer acquisition processes effectively.
Formula: CPA = Total Cost of Acquisition/Number of New Customers Acquired
13. Return on Advertising Spend
Return on advertising spend is one of the critical marketing KPIs for operations managers, serving as a quantitative measure of the revenue generated for every dollar spent on advertising. It is a powerful indicator of the effectiveness and efficiency of a company’s advertising campaigns.
A high ROAS implies that the revenue generated significantly exceeds the advertising costs, suggesting a profitable and successful campaign. On the other hand, a low ROAS may indicate that the return on investment from advertising is not meeting expectations, prompting operations managers to reevaluate and refine their marketing strategies. Operations managers can utilize ROAS to optimize marketing budget allocation, identify successful channels, and make data-driven decisions to maximize the impact of advertising efforts on overall business profitability.
Formula: ROAS = Revenue Generated From Advertising/ Cost of Advertising
14. Time to Payback
Time to payback in marketing operations refers to the duration it takes for a company to recover the costs associated with acquiring a new customer. It is essentially a measure of the efficiency of marketing campaigns in terms of cost recovery.
A low time to payback is favorable, signifying a swift recovery of customer acquisition costs and a quicker return on investment. Conversely, a high time to payback suggests a longer period for cost recovery, which may raise concerns about the effectiveness and sustainability of marketing initiatives. Operations managers can use this metric to assess the efficiency of marketing efforts, optimize campaign strategies, and ensure a more rapid and cost-effective return on investment.
Formula: Time to Payback = Customer Acquisition Costs/ Average Monthly Gross Margin per Customer
15. Marketing-Originated Customer Percentage
Marketing-originated customer percentage is a key performance indicator in marketing operations, providing insights into the percentage of customers that can be attributed to marketing efforts within a specific period. It serves as a valuable measure of the effectiveness of marketing campaigns in driving customer acquisition.
A high marketing-originated customer percentage indicates that a significant proportion of new customers were influenced by marketing strategies, showcasing the success of marketing campaigns in attracting and converting leads. On the other hand, a low percentage suggests a need for adjustments in marketing strategies to enhance their impact on customer acquisition. Operations managers can leverage this KPI to gauge the return on marketing investments, refine campaign strategies, and optimize resource allocation to bolster customer acquisition through effective marketing initiatives.
Formula: Marketing-Originated Customer Percentage = (Number of Customers Acquired Through Marketing/Total Number of New Customers) ×100
Human Resource KPIs For Operations Managers
16. Absenteeism rate
The absenteeism rate is a metric that quantifies the frequency and extent of employee absences. It is defined as the percentage of scheduled work hours that employees are absent due to various reasons, such as illness, personal issues, or other unforeseen circumstances. The absenteeism rate provides valuable insights into workforce attendance patterns and employee engagement.
A high absenteeism rate may indicate potential issues within the workplace, such as low morale, dissatisfaction, or health concerns, which can negatively impact overall productivity. Conversely, a low absenteeism rate is generally associated with a motivated and engaged workforce. Operations managers can utilize this KPI to identify trends, address underlying concerns, and implement strategies to promote a healthier and more productive work environment.
Formula: Absenteeism Rate = (Total Scheduled Hours of Absence/Total Scheduled Work Hours) ×100
17. Overtime Hours
Overtime hours refer to the additional hours employees work beyond their regular scheduled work hours. This metric is crucial in understanding human resource utilization and indicates the workload demands on a workforce.
When overtime hours are high, it may signify increased workloads, tight deadlines, or understaffing, potentially leading to concerns about employee burnout, decreased morale, and increased labor costs. On the other hand, low overtime hours suggest efficient workforce management or a period of reduced demand. Operations managers utilize this metric to strike a balance between meeting operational demands and ensuring the well-being and productivity of the workforce.
Formula: Overtime Hours = Total Hours Worked - Scheduled Work Hours
18. Employee Turnover Rate
Employee turnover rate quantifies the percentage of employees who leave a company within a specific timeframe. This metric serves as a key indicator of workforce stability and organizational health.
A high turnover rate may suggest issues such as dissatisfaction, lack of engagement, or inadequate workplace conditions, potentially impacting overall productivity and morale. On the other hand, a low turnover rate typically signifies a stable and content workforce, reflecting positive workplace culture and effective talent management. Operations managers, armed with insights from this metric, can implement targeted strategies to reduce turnover, enhance employee satisfaction, and foster a more resilient and engaged workforce.
Formula: Employee Turnover Rate = (Number of Employees Departed/Average Number of Employees) ×100
19. Employee Efficiency Metrics
Employee efficiency serves as an invaluable KPI for operations managers, providing a comprehensive understanding of workforce productivity. These metrics include:
A high number of deals closed YTD signals a robust and proactive sales effort, showcasing the team’s ability to navigate the sales pipeline and capitalize on opportunities. Conversely, a low number may suggest potential challenges or inefficiencies in the sales process, prompting operations managers to assess and refine sales strategies. Operations managers leverage this KPI to gauge the overall health of the sales function, set realistic targets, and implement targeted improvements to optimize deal conversion rates and, ultimately, drive revenue growth.
21. Customer Churn Rate
Customer churn rate is a critical sales operations KPI that quantifies the percentage of customers who discontinue their relationship with a business within a given period. This metric serves as a key indicator of customer attrition and the overall health of a customer base.
A high churn rate typically suggests issues with customer satisfaction, service quality, or competitive pressures, signaling potential revenue loss. Conversely, a low churn rate indicates a stable and satisfied customer base, reflecting successful customer retention strategies. Operations managers can utilize the churn rate to identify patterns, understand the reasons behind customer departures, and implement targeted measures to enhance customer satisfaction and loyalty.
Formula: Customer Churn Rate = Number of Customers Lost During a Period/Number of Customers at the Start of the Period) ×100
22. Lead-to-Opportunity Ratio
The lead-to-opportunity ratio is a key performance indicator in sales operations to assess the efficiency of converting leads into qualified opportunities. A high lead-to-opportunity ratio suggests a successful lead generation and qualification process, indicating that a substantial percentage of leads are translating into potential revenue-generating opportunities.
Conversely, a low ratio may imply inefficiencies in lead nurturing or qualification, signaling the need for improvements in the sales process to enhance conversion rates. Operations managers in sales can leverage this KPI to refine lead management strategies, optimize marketing efforts, and ensure a streamlined conversion pipeline, ultimately contributing to increased revenue and business success.
Formula: Lear-to-Opportunity Ratio = (Number of Opportunities Created/Number of Leads Generated) ×100
A high lead conversion rate suggests a streamlined and effective sales process, indicating that a significant proportion of leads are progressing through the sales funnel to become valuable customers. On the contrary, a low lead conversion rate may signify inefficiencies or gaps in the sales strategy, prompting operations managers to reassess and optimize their lead management practices. Operations managers can leverage this metric to refine sales strategies, identify areas for improvement, and enhance overall sales performance, ultimately contributing to the company’s bottom line.
Formula: Lead Conversion Rate = (Number of Converted Leads/Total Number of Leads) ×100
IT KPIs For Operations Managers
24. Total Tickets vs Open Tickets
The number of total tickets vs open tickets provides insights into the efficiency of an IT support system. Total tickets represent the overall number of requests or issues raised by users, while open tickets are the subset that remains unresolved or in-progress. In essence, this KPI measures the ratio of resolved or closed tickets to the total number of tickets, offering a snapshot of the IT team’s responsiveness and effectiveness.
A high ratio indicates a swift resolution of issues, suggesting a proficient and agile IT support system. Conversely, a low ratio may signify a backlog of unresolved issues, potential inefficiencies, or challenges in meeting user demands promptly. Operations managers can utilize this KPI to gauge the health of their IT support services, make informed decisions on resource allocation, and ensure that user concerns are addressed in a timely manner, ultimately contributing to enhanced operational efficiency and user satisfaction.
25. Ticket Response Time
The duration it takes for a support team to respond to user-reported issues or service requests is called ticket response time. It serves as a key indicator of the efficiency and effectiveness of an IT support system.
A low response time is generally desirable, as it signifies a prompt acknowledgment of user concerns and a swift initiation of troubleshooting or problem resolution. Conversely, a high response time may indicate delays in addressing user issues, potentially leading to increased user frustration and a negative impact on overall service quality. Operations managers can leverage insights from this KPI to optimize IT support workflows, allocate resources efficiently, and enhance the overall user experience with IT services.
Formula: Ticket Response Time = [(Time of First Response - Time of Ticket Creation)/Number of Tickets]
26. Resolution Rate
Resolution rate is a critical IT operations KPI for operations managers that quantifies the effectiveness of resolving issues or incidents within a specified timeframe. This metric serves as a key performance indicator for IT support teams, measuring their efficiency in addressing and resolving technical challenges.
A high resolution rate signifies a swift and effective response to issues, indicating operational excellence and customer satisfaction. On the other hand, a low resolution rate may suggest inefficiencies in the IT support process. This can potentially lead to prolonged system downtimes and dissatisfied end-users. Operations managers can utilize this metric to gauge the performance of their IT support teams and identify areas for improvement. They can also ensure the smooth functioning of IT operations in alignment with organizational goals.
Formula: Resolution Rate = (Number of Incidents Resolved/Total Number of Incidents Reported) ×100
27. Mean Time to Recover
Mean time to recover quantifies the average time taken to restore a system/service to normal functioning after an incident or outage. It serves as a key performance indicator for operations managers in the IT industry. It also offers valuable insights into the efficiency of incident resolution processes.
A low MTTR indicates a swift and effective response to incidents, minimizing downtime and disruptions to IT services. Conversely, a high MTTR suggests a prolonged recovery process, potentially leading to increased downtime and adverse impacts on productivity. Operations managers use MTTR to assess the effectiveness of incident management, refine response strategies, and ensure timely service restoration. Ultimately, contributing to the resilience and reliability of IT systems within an organization.
Formula: MTTR = Total downtime/Number of Incidents
28. Technology Downtime
Technology downtime is when a system, network, or technology infrastructure is unavailable or not functioning as intended. It is the time when IT services or systems are offline, disrupting normal business operations. This metric is a key indicator of the reliability and resilience of an organization’s technological infrastructure.
A high technology downtime indicates a greater frequency or duration of disruptions. It can potentially lead to decreased productivity, customer dissatisfaction, and financial losses. Conversely, a low technology downtime suggests a more stable and robust IT environment, ensuring seamless business operations. Operations managers can utilize this KPI to pinpoint areas for improvement in IT systems and implement preventive measures. It can also ensure the uninterrupted flow of technology-dependent processes, safeguarding the overall efficiency and reliability of the organization.
Supplier and carrier costs quantify the expenses associated with sourcing materials from suppliers and transporting them through various carriers. It reflects the financial efficiency of the supply chain.
A high score indicates a dependable network, ensuring timely and quality deliveries. On the contrary, a low score may signal disruptions or inconsistencies, prompting operations managers to reassess and potentially diversify their supplier and carrier base. Operations managers can utilize this KPI to identify underperforming partners, negotiate improvements, and ensure a smooth and reliable flow of goods.
31. Inventory Turns and Carrying Costs
Inventory turns and carrying costs represent the number of times inventory is sold or used in a given period and the associated costs of holding that inventory. A high inventory turns value implies efficient inventory management, with goods swiftly transitioning from shelves to customers.
On the flip side, a low value may indicate overstocking, leading to increased carrying costs. Operations managers can utilize these KPIs to refine inventory strategies, minimize holding costs, and enhance overall supply chain efficiency.
Formula: Inventory Turns = Cost of Goods Sold/Average Inventory Value
32. Order Fill and Back Order Rates
Order fill rate measures the percentage of customer orders that are fulfilled completely on the first attempt, while the back order rate tracks the orders that cannot be filled immediately and are delayed.
High order fill rates signify efficiency and customer satisfaction, while high back order rates may indicate inventory shortages or inefficient order processing systems. Operations managers can utilize these KPIs to optimize inventory levels, improve order processing, and enhance customer service.
Formula: Order Fill Rate = Number of Order Filled/ Total Number of Orders
Conversely, a low accuracy rate may lead to order discrepancies and additional costs for corrections. Operations managers can utilize this KPI to identify areas for improvement in warehouse processes, implement training programs, and enhance overall order accuracy.
34. Order Lead Time
Order lead time measures the time it takes from order placement to delivery, encompassing various stages. Short lead times indicate operational efficiency and customer responsiveness, while extended lead times may result in customer dissatisfaction and increased operational costs. Operations managers can utilize this KPIs to streamline processes, optimize workflows, and improve overall supply chain agility.
35. Receiving and Put-Away Cycle Times
Receiving and put-away cycle times evaluate the efficiency of receiving and storing goods upon arrival. Short cycle times indicate streamlined processes, reducing delays in inventory availability.
Prolonged cycle times, on the other hand, may result in operational bottlenecks and increased storage costs. Operations managers can utilize these KPIs to streamline receiving and storage processes, reducing bottlenecks and improving overall warehouse efficiency.
36. Transportation Costs
Transportation costs quantify the expenses associated with moving goods from suppliers to the distribution center and, eventually, to customers. High transportation costs may suggest inefficiencies or suboptimal route planning, impacting overall supply chain profitability. Operations managers can utilize this KPI to optimize transportation routes, negotiate favorable agreements with carriers, and reduce overall distribution expenses.
Formula: Transportation Costs = Cost per Mile x Total Miles Travelled
37. Transportation Delivery(SLA)
Transportation delivery (Service Level Agreement) measures the adherence to agreed-upon delivery timelines. High SLA compliance ensures reliability and customer satisfaction, while low compliance rates may lead to service disruptions and potential damage to customer relationships. Operations managers can utilize this KPI to monitor carrier performance, negotiate improved delivery terms, and ensure the timely arrival of goods.
38. Quote to Cash Cycle Time
Quote to cash cycle time calculates the duration from the initial customer quote to receiving payment. A shorter cycle time indicates a streamlined order-to-payment process, contributing to improved cash flow. Conversely, a prolonged cycle time may result in delayed revenue recognition and increased working capital requirements. Operations managers can utilize this KPI to streamline sales and billing processes, reducing cycle times and improving overall financial performance.
Finance KPIs For Operations Managers
39. Account Receivables Turnover
Accounts receivables turnover is a finance operations KPI that gauges the efficiency of a company in collecting payments from customers. A high turnover indicates a swift conversion of receivables into cash, reflecting strong cash flow and effective credit management.
Formula: Account Receivable Turnover = Net Credit Sales/ Average Accounts Receivable
40. Days Sales Outstanding
Days sales outstanding is a metric that quantifies the average number of days it takes for a company to collect payments after a sale has been made. It serves as a critical finance operations KPI, representing the efficiency of a company’s credit and collection processes.
Formula: Days Sales Outstanding = (Accounts Receivable/ Net Credit Sales) × Number of Days in Period
41. Operating Cash Flow
Operating cash flow is a finance operations KPI that measures the cash generated or used by a company’s core operating activities. It provides insights into a company’s ability to generate cash from its regular business operations. A positive operating cash flow indicates financial health, liquidity, and the capacity to cover operating expenses.
Conversely, a negative operating cash flow may signify liquidity challenges. Operations managers can utilize this KPI to ensure there is sufficient cash to fund ongoing operations, invest in growth opportunities, and meet financial obligations.
Formula: Operating Cash Flow=Net Income+Non-Cash Expenses+Changes in Working Capital
42. Quick Ratio
The quick ratio also known as the acid-test Ratio, is a finance operations KPI that measures a company’s ability to meet its short-term obligations using its most liquid assets. It is a more stringent measure than the current ratio as it excludes inventory from current assets.
A high quick ratio suggests strong liquidity and an ability to cover short-term liabilities promptly. Conversely, a low quick ratio may indicate potential difficulties in meeting short-term obligations. Operations managers can utilize this KPI to assess short-term liquidity and make informed decisions about managing current liabilities.
Formula: Quick Ratio = (Cash + Marketable Securities + Receivables)/ Current Liabilities
43. Accounts Payable Turnover
Accounts payable turnover assesses how efficiently a company manages its accounts payable by measuring the number of times a company pays its average accounts payable during a specific period.
A high turnover suggests effective management of payables and efficient cash flow, while a low turnover may indicate potential liquidity challenges or delayed payments. Operations managers can utilize this KPI to optimize payment processes, negotiate favorable credit terms, and enhance overall financial efficiency.
Formula: Accounts Payable Turnover = Net Credit Purchases/ Average Accounts Payable
44. Cash Conversion Cycle
The cash conversion cycle measures the time it takes for a company to convert its investments in inventory and other resources into cash flow from sales. It reflects the efficiency of a company’s working capital management.
Operating profit margin is a finance operations KPI that measures the profitability of a company’s core operating activities. It is expressed as a percentage and indicates the proportion of revenue that remains as operating profit after deducting operating expenses.
A high operating profit margin suggests operational efficiency and effective cost management, while a low margin may indicate potential challenges in controlling expenses. Operations managers can utilize this KPI to assess the efficiency of core operations, identify cost-saving opportunities, and enhance overall financial performance.
Net profit margin measures the overall profitability of a company by expressing net profit as a percentage of total revenue. It provides insights into a company’s ability to generate profit after all expenses, including taxes and interest.
Formula: Net Profit Margin = (Net Profit/Net Sales) ×100
Manufacturing KPIs For Operations Managers
47. Product Development Costs and Time-to-Market
Product development costs and time-to-market in manufacturing operations KPIs refer to the expenditures incurred and the time taken to bring a new product from conceptualization to market availability. This KPI indicates the efficiency of the product development process, reflecting a company’s innovation speed and cost-effectiveness.
A high value may suggest prolonged development cycles and increased costs, potentially impacting competitiveness. Conversely, a low value signifies swift development and cost control, enhancing market responsiveness. Operations managers can utilize this KPI to streamline innovation processes, optimize resource allocation, and align product releases with market demands.
48. Job Cost and WIP Reporting
Job cost and work-in-progress (WIP) reporting represent the total cost incurred for completing a specific manufacturing job and the ongoing value of work in progress. This KPI indicates the financial efficiency and progress of manufacturing processes, with a high value signaling potential cost overruns or delays.
A low value implies effective cost control and timely job completion. Operations managers can leverage this KPI to manage production costs, improve resource utilization, and optimize workflow.
49. Scrap and Yield Quantities and Costs
Scrap and yield quantities and costs measure the volume of defective or wasted products in comparison to the total produced, along with associated costs. This KPI reflects the efficiency of production processes and product quality.
A high value indicates a high level of waste, which can result in increased costs and reduced profitability. Conversely, a low value signifies efficient production with minimal waste. Operations managers can utilize this KPI to identify areas for quality improvement, optimize production processes, and reduce costs.
50. Manufacturing Labor Efficiency
Manufacturing labor efficiency is a KPI that gauges the productivity of labor in the manufacturing process. This KPI indicates how effectively labor resources are utilized in manufacturing. A high value suggests efficient use of labor, minimizing costs per unit.
Conversely, a low value may indicate inefficiencies, leading to increased labor costs. Operations managers can leverage this KPI to optimize workforce management, identify training needs, and enhance overall production efficiency.
Formula: Manufacturing Labor Efficiency = (Actual Production Output/Standard Production Output) x 100
51. Machine and Resource Throughput
Machine and resource throughput in manufacturing operations KPIs measure the rate at which machines or resources complete tasks within a given time period. This KPI reflects the operational efficiency of machinery and resources.
A high value indicates optimal throughput and resource utilization, contributing to increased productivity. On the contrary, a low value may signal bottlenecks or underutilized resources. Operations managers can use this KPI to identify areas for improvement, allocate resources effectively, and enhance overall production capacity.
52. Production Schedule Attainment
Production schedule attainment is a KPI that assesses the extent to which actual production matches the planned production schedule. This KPI provides insights into operational reliability and adherence to timelines.
A high value suggests a consistent and reliable production schedule, contributing to customer satisfaction. Conversely, a low value may indicate challenges in meeting production targets, potentially affecting customer relationships and order fulfillment. Operations managers can utilize this KPI to optimize production planning, improve resource allocation, and enhance on-time delivery performance.
Formula: Production Schedule Attainment = (Actual Production Output/Planned Production Output) x 100
53. Resource Capacity Utilization
Resource capacity utilization measures the extent to which available resources are utilized in production. This KPI indicates the efficiency of resource allocation and utilization.
A high value suggests optimal utilization, contributing to cost-effectiveness. On the other hand, a low value may indicate underutilized resources, leading to increased per-unit costs. Operations managers can use this KPI to optimize resource allocation, identify areas for improvement, and enhance overall operational efficiency.
Formula: Resource Capacity Utilization = (Actual production Output/Maximum Possible Production Output) x 100
54. Changeover Time
Changeover time is a critical manufacturing operations KPI that measures the time taken to transition from producing one product to another. This KPI indicates the efficiency of changeover processes and the ability to adapt to different production requirements swiftly.
A high value suggests prolonged changeover times, potentially causing production delays and impacting overall efficiency. Conversely, a low value signifies quick and efficient changeovers, enhancing production flexibility. Operations managers can utilize this KPI to optimize production schedules, reduce downtime, and enhance overall operational agility.
55. Overall Equipment Efficiency (OEE)
Overall equipment efficiency is a comprehensive manufacturing operations KPI that assesses the performance, availability, and quality of equipment in the production process. OEE provides a holistic view of equipment effectiveness, with a high value indicating optimal equipment performance.
Conversely, a low value suggests potential areas for improvement, such as increased downtime or reduced production speed. Operations managers can use OEE to identify and address equipment-related inefficiencies, improve maintenance strategies, and enhance overall production effectiveness.
56. Sub-Contractor Performance
Sub-contractor performance is a KPI that evaluates the effectiveness and reliability of subcontractors engaged in the manufacturing process. This KPI indicates the impact of external contributors on overall operational success. A high value signifies dependable subcontractors contributing positively to production.
In contrast, a low value may indicate challenges such as delays or quality issues introduced by subcontractors. Operations managers can utilize this KPI to make informed decisions about subcontractor relationships, optimize supply chain partnerships, and ensure consistent production quality.
57. Capable-to-Promise (CTP)%
Capable-to-promise is a manufacturing operations KPI that evaluates a company’s ability to commit to fulfilling customer orders based on current production capabilities. This KPI indicates how effectively a company can meet customer expectations regarding order fulfillment.
A high CTP% value suggests a robust production system capable of accommodating customer demands. Conversely, a low value may indicate challenges in meeting order commitments, potentially affecting customer satisfaction. Operations managers can leverage this KPI to enhance production planning, optimize inventory levels, and improve customer order fulfillment.
Formula: CTP% = (Available-to-Promise/Total Demand) x 100
Construction KPIs For Operations Managers
58. Safety/Incident Rate
Safety/Incident rate is a crucial construction operations KPI that measures the frequency of safety incidents or accidents on a construction site. This metric is defined as the number of incidents (injuries, accidents, or near misses) per a specific unit of measurement. It is often expressed per 100,000 work hours.
A low safety/incident rate is indicative of a safe work environment, emphasizing the success of safety protocols and measures. Conversely, a high rate may signal potential hazards, prompting operations managers to reassess safety procedures. Operations managers can utilize this KPI to prioritize and enhance safety measures. Also, ensuring the well-being of the workforce and compliance with safety regulations.
59. Request for Information Win Rates
Request for information(RFI) win rates assesses the success of winning contracts or projects after responding to requests for information. A high win rate indicates effective bidding strategies and a competitive edge in the market. While a low rate may signify areas that require improvement. Operations managers can utilize this KPI to refine bidding approaches, better understand market dynamics, and optimize resource allocation.
Formula: Request for Information(RFI) Win Rates = (Number of Projects Won/Total Number of RFIs Submitted) x 100
60. Job Cost, Revenue, and Profitability
Job cost, revenue, and profitability are vital construction operations KPIs that gauge the financial performance of construction projects. The total expenses incurred during a project are job costs, the income generated is the revenue, and profitability is the net profit derived from subtracting costs from revenue.
High job costs relative to revenue can indicate financial inefficiency, while low profitability may signal unsuccessful project management. Operations managers can utilize these metrics to assess project financial health, and identify areas for cost optimization.
61. Quality Defects, Rework Costs and Time, Number of Inspections
Quality defects, rework costs and time, and number of inspections are interconnected construction operations KPIs. They measure the quality and efficiency of construction projects. On one hand quality defects represent deviations from project specifications. While rework costs and time quantify the resources spent on correcting defects. The number of inspections measures how frequently quality checks are conducted.
Low quality defects, rework costs, and inspection frequency indicate efficient project execution. While high values may suggest the need for improved quality control. Operations managers can utilize these KPIs to streamline project processes, enhance quality control, and minimize unnecessary expenditures.
62. Employee Retention
Employee retention measures the percentage of employees who remain with the construction company over a specific period. High employee retention signifies a positive work environment, skilled workforce, and effective management.
Conversely, low retention rates may signal issues with workplace satisfaction or leadership. Operations managers can utilize this KPI to implement strategies for talent retention. They can also foster a positive workplace culture, and address any underlying concerns.
Formula: Employee Retention Rate = (Number of Employee Retained/Total Number of Employees at Start of Period) x 100
63. Labor Efficiency/Utilization
Labor efficiency assesses how effectively labor resources are utilized on a construction project. High labor efficiency indicates optimal resource utilization, while low efficiency may suggest underutilization or inefficiencies in project planning. Operations managers can utilize this KPI to optimize workforce allocation, improve project scheduling, and enhance overall labor productivity.
Subcontractor inventory is a construction operations KPI that evaluates the availability and efficiency of subcontractors for construction projects. It is defined as the number of qualified subcontractors available for hire at any given time.
High subcontractor inventory indicates a robust network of qualified subcontractors, facilitating flexibility in project staffing. On the other hand, a low inventory may lead to delays and increased costs. Operations managers can utilize this KPI to ensure a reliable pool of subcontractors, manage project timelines effectively, and mitigate risks associated with subcontractor availability.
Professional Service KPIs For Operations Managers
65. Average and Realized Bill Rates
Average bill rate represents the average price charged for professional services, while realized bill rate is the actual revenue generated per billable hour. These metrics provide insights into the pricing structure’s effectiveness and how well it aligns with the market. High rates indicate value perception, but if too high, it may lead to client dissatisfaction. Low rates may attract clients, but it could impact profitability.
66. Employee Utilization/Billable Rate
Employee utilization/billable rate gauges the percentage of an employee’s time spent on billable client work. High utilization rates signify efficient resource allocation, but excessive rates may lead to burnout. Low rates suggest underutilization, potentially impacting revenue. Operations managers can optimize team productivity by balancing utilization rates.
67. Billable Revenue Per Resource
Billable revenue per resource measures the average revenue generated per service professional. A high figure indicates efficient resource utilization, while low figures may signify inefficiencies. Operations managers can use this metric to assess team productivity and adjust staffing levels to meet demand.
68. Project Estimate Accuracy
Project estimate accuracy reflects how closely initial project estimates align with the actual effort and cost. High accuracy signifies effective project planning, leading to client satisfaction and profitability. Low accuracy may result in cost overruns and strained client relationships.
69. Project/Service Revenue, Profitability, Deal Size, and Bid-to-Win Ratios
These encompass a suite of metrics evaluating project or service success. Revenue and profitability showcase financial performance, deal size indicates project scale, and bid-to-win ratios highlight the effectiveness of securing new projects. High values across these metrics indicate successful project management and business development.
70. SaaS Contract Metrics (ARR, ACV, and Churn)
Annual recurring revenue (ARR), Annual contract value (ACV), and churn rate are very important metrics for SaaS contracts. ARR and ACV showcase subscription revenue, while Churn measures customer retention. High ARR and ACV are favorable, while low Churn indicates satisfied customers. Operations managers can use these metrics to refine subscription pricing, improve service, and ensure long-term customer relationships.
Formula:
ARR = Monthly Recurring Revenue (MRR) x 12
ACV = Average Monthly Contract Value (MCV) x 12
Churn Rate = (Number of Customers Lost/Total Customers at Start of Period) x 100
From the intricate details of retail operations, such as gross margins and inventory turnover, to the intricacies of human resources, including absenteeism rate and employee turnover, and extending to the critical domains of sales, IT operations, manufacturing, finance, construction and distribution, each KPI paints a distinct picture of efficiency, effectiveness, and overall operational health. These KPIs for operations managers act as instruments, finely tuned to provide insights into the complex landscape of operational facets.
+
ERP Implementation Failure Recovery
Learn how Frederick Wildman struggled with Microsoft Dynamics 365 ERP implementation failure even after spending over $5M and what options they had for recovery.
KPIs (key performance indicators) for an operations manager may include a range of metrics across different areas such as retail, human resources, IT, finance, marketing, sales, distribution, manufacturing, construction, and professional services.
How do you measure operations manager performance?
Operations manager performance can be measured by assessing their effectiveness in achieving key objectives and targets related to the specific KPIs relevant to their role. This involves monitoring and evaluating their contributions to the success of the organization in areas such as cost management, efficiency, employee management, and overall operational excellence. Regular performance reviews, feedback sessions, and data-driven assessments based on KPIs can be used to gauge their effectiveness.
What are KPIs to improve operational performance?
To improve operational performance, organizations can focus on key performance indicators that highlight areas for enhancement and growth. Some overarching KPIs to consider for improving operational performance include retail, human resources, IT, finance, marketing, sales, distribution, manufacturing, construction, and professional services KPIs respectively.
In pursuing greater profitability and scalability, companies know the critical role production plays in transforming raw materials into finished products. However, production is not immune to challenges, ranging from delivery delays to defective units and product returns, which can significantly impact a company’s bottom line.
To tackle these challenges in the manufacturing industry, the role of a production manager is often pivotal, yet the roles and responsibilities can vary significantly across industries. Some companies might integrate this responsibility with an operations manager, while others in the manufacturing sector might have a dedicated position for a production manager. The roles of a production manager might also overlap with quality managers, with their primary responsibilities being managing production, managing schedules, and getting the maximum out of the production floor.
So, which KPIs for production managers are the most critical for the production manager role? To ensure they can keep track of production and maintain records of what is done correctly and incorrectly, a production manager should monitor these 5 specific KPIs for production managers.
Performance KPIs For Production Managers
Performance manufacturing KPIs for production managers include a set of key indicators designed to gauge and enhance the efficiency of the manufacturing process. These metrics serve as quantitative measures that reflect the effectiveness and productivity of the production floor. Within these metrics, three key performance indicators take center stage – production/schedule attainment, changeover time, and takt time. Let’s see what each of these KPIs means and what they indicate.
1. Production/Schedule Attainment
Production/Schedule attainment in manufacturing quantifies the extent to which actual production aligns with scheduled production targets. The manufacturing operation’s efficiency and its ability to meet predetermined production levels are measured by this metric.
Formula: Production attainment = (Actual production / scheduled production) x 100
A higher production attainment score signifies superior performance, indicating that the manufacturing process operates in sync with planned schedules. In practical terms, if a company aims to produce 100 units in a given time frame and achieves 95 units, the production attainment would be 95%, showcasing a commendable alignment with production goals. Conversely, a lower production attainment percentage suggests a divergence from scheduled targets, potentially indicating inefficiencies, delays, or challenges within the manufacturing process.
2. Changeover Time
Changeover time represents the duration required to transition a production line from manufacturing one product to another. This time interval encompasses the various tasks involved in the changeover process, such as equipment adjustments, line reconfigurations, and any necessary preparations to ensure optimal production of the new item.
Formula: Average changeover time = Total time to changeover production lines / # of changeovers
A lower average changeover time indicates a streamlined and efficient changeover process, allowing for increased flexibility in responding to shifts in production demands. For instance, if a manufacturing facility undergoes four changeovers with a total time investment of 240 minutes, the average changeover time would be 60 minutes. On the other hand, a high changeover time suggests inefficiencies in the transition process, potentially leading to production delays, increased downtime, and reduced overall operational agility.
3. Takt Time
Takt time is one of the fundamental performance manufacturing KPIs for production managers. It represents the pace at which a product must be completed to meet customer demand.
Formula: Takt time = Total available production time / average customer demand
A low takt time indicates a faster production pace, allowing the manufacturing process to keep up with or even exceed customer demand. This can signify a responsive and efficient production system, ensuring that products are delivered on time. Conversely, a high takt time suggests a slower pace relative to customer demand, potentially leading to production bottlenecks, delays, and an inability to meet market needs promptly.
The 2025 Digital Transformation Report
Thinking of embarking on a ERP journey and looking for a digital transformation report? Want to learn the best practices of digital transformation? Then, you have come to the right place.
Lean manufacturing KPIs for production managers are designed to evaluate the efficiency, productivity, and overall effectiveness of manufacturing processes within the lean manufacturing philosophy. These metrics are instrumental in identifying areas for improvement, minimizing waste, and optimizing resource utilization. Several critical KPIs fall under the umbrella of lean manufacturing metrics, such as cycle time, first pass yield, capacity utilization, machine downtime rate, material yield variance, and overtime rate. Each of them offers unique insights into different aspects of the production system.
4. Cycle Time
Cycle time refers to the average duration it takes to fulfill a customer order, serving as a crucial metric to gauge operational efficiency and customer responsiveness.
Formula: Cycle time = (Time customer received order – time customer placed order) / # total shipped orders
A lower cycle time suggests that the business can rapidly and effectively meet customer demands, reflecting streamlined processes and efficient workflows. For instance, if a company receives an order on Monday at 10:00 AM and delivers the product to the customer on Wednesday at 2:00 PM, with a total of 50 orders shipped, the cycle time would be (Wednesday 2:00 PM – Monday 10:00 AM) / 50, indicating the average time it takes to process and fulfill an order. On the other hand, a high cycle time may signal inefficiencies, potential delays, and a decreased ability to promptly respond to customer requests, which could impact customer satisfaction and competitiveness in the market.
5. First Pass Yield
First pass yield quantifies the proportion of non-defective products successfully manufactured without rework or scrap.
Formula: First pass yield = # of non-defective products excluding rework and scrap / total # of products manufactured
A high first pass yield indicates a robust and reliable manufacturing process, where most products meet quality standards on the initial attempt. This suggests efficiency, cost-effectiveness, and a minimized need for additional resources to rectify defects. Conversely, a low first pass yield suggests potential issues in the manufacturing process, such as inadequate quality control or inconsistencies in production.
6. Capacity Utilization
Capacity utilization quantitatively measures how much of a plant’s production capacity is actively utilized within a specific timeframe.
Formula: Capacity utilization = (Total capacity used during specific timeframe / total available production capacity) X 100.
A high capacity utilization percentage indicates that the manufacturing facility is operating efficiently and using its resources optimally. For instance, if a factory with a production capacity of 10,000 units produces 9,000 units monthly, the capacity utilization would be 90%. This suggests that the facility is running close to its maximum potential, leaving little room for additional production without expansion. On the other hand, a low capacity utilization percentage may signal underutilization of resources, inefficient production planning, or excess capacity.
7. Machine Downtime Rate
Machine downtime rate is one of the critical KPIs for production managers in manufacturing that quantifies the proportion of time equipment is unavailable for production due to both planned and unplanned downtime. This metric serves as a key indicator of equipment reliability, operational efficiency, and the effectiveness of maintenance practices.
Formula: Machine downtime rate = Total uptime / total uptime + total downtime
A low machine downtime rate suggests that machinery is consistently available for production, minimizing disruptions and ensuring a smooth workflow. Conversely, a high machine downtime rate signals frequent disruptions, potentially leading to production delays, increased costs, and a compromised production schedule.
8. Material Yield Variance
Material yield variance assesses the difference between the actual amount of material used and the standard amount expected for a given production process. This variance provides insights into the efficiency of material utilization during production.
Formula: Material yield variance = (Actual unit usage – standard unit usage) x standard cost per unit
A high material yield variance indicates that more material is being consumed than the predetermined standard, potentially signaling inefficiencies, waste, or deviations in the manufacturing process. Conversely, a low or negative material yield variance suggests that less material is used than the standard, potentially signaling cost savings and raising questions about quality or adherence to specifications.
9. Overtime Rate
Overtime rate measures the proportion of excess hours employees work beyond their regularly scheduled working hours. This metric provides valuable insights into workforce management, labor efficiency, and operational costs.
Formula: Overtime rate = (Overtime hours / total hours worked, including overtime) X 100
A high overtime rate suggests that a significant portion of the workforce is working beyond standard hours, potentially indicating high demand, tight deadlines, or understaffing. While this might signify a committed and flexible workforce, it can also increase labor costs, fatigue, and potential burnout. Conversely, a low overtime rate may suggest effective workforce planning and a balanced workload, contributing to employee well-being and cost control.
Quality KPIs For Production Managers
Quality manufacturing KPIs for production managers are specifically designed to measure and evaluate manufacturing processes’ overall quality and effectiveness. These metrics provide insights into various aspects of the production system, highlighting areas for improvement and ensuring that the final output meets or exceeds quality standards. Several critical KPIs fall under the umbrella, each addressing different facets of the manufacturing quality such as yield, first-time yield, and scrap rate.
10. Yield
Yield in manufacturing quantifies the efficiency of the production process by measuring the overall volume of products manufactured compared to the input of raw materials.
Formula: Yield = (Actual # of products manufactured / theoretical number of maximum possible yield based on raw materials input) X 100
A high yield indicates that the manufacturing process utilizes raw materials effectively, minimizes waste, and maximizes production output. Conversely, a low Yield suggests inefficiencies, waste, or issues in the production process, potentially leading to increased costs and reduced overall productivity.
11. First Time Yield
First time yield is one of the critical quality KPIs for production managers in manufacturing, serving as a key indicator of product quality and the efficiency of production processes. This KPI measures the percentage of non-defective or good units that are released without wasteful rework.
Formula: First time yield = # of non-defective or good units / total # of products manufactured
A high first time yield indicates that most products meet quality standards on the initial attempt, signaling an efficient and reliable manufacturing process. Conversely, a low first time yield suggests that many products require rework or correction, potentially indicating issues with material quality, equipment, or production processes.
12. Scrap Rate
Scrap rate quantifies the proportion of discarded materials during the manufacturing process. This metric provides insights into the efficiency of the production process, waste reduction efforts, and the utilization of raw materials.
Formula: Scrap rate = Amount of scrap material produced during a manufacturing job / total materials intake or put into the process
A low scrap rate indicates effective material utilization, minimized waste, and potential cost savings through efficient resource management. Conversely, a high scrap rate suggests inefficiencies, potentially resulting from production errors, equipment malfunctions, or poor-quality materials.
Maintenance KPIs For Production Managers
Maintenance manufacturing KPIs for production managers are designed to evaluate the effectiveness, reliability, and efficiency of maintenance processes within manufacturing operations. These metrics are instrumental in gauging equipment performance, minimizing downtime, and optimizing the maintenance strategy for enhanced productivity. KPIs like mean time between failure, percentage maintenance planned, percentage planned or emergency work orders, unscheduled downtime, downtime analysis, and machine set-up time, collectively fall under the umbrella of maintenance manufacturing metrics.
13. Mean Time Between Failures(MTBF)
MTBF is a crucial metric that calculates the average time a piece of equipment operates between failures. It provides insights into the reliability of production assets and is particularly useful for predicting maintenance needs.
Formula: MTBF = Operating time in hours / # of failures
A high MTBF suggests a reliable and robust system, minimizing disruptions and ensuring continuous production. Conversely, a low MTBF indicates frequent breakdowns, potentially leading to increased maintenance costs and decreased productivity.
14. Percentage Maintenance Planned(PMP)
PMP compares the total hours spent on planned maintenance activities with the overall maintenance time. It indicates the effectiveness of proactive maintenance planning.
Formula: Percentage planned maintenance = (# of planned maintenance hours / # of total maintenance hours) × 100
A higher PMP signifies a well-organized maintenance strategy, reducing unexpected downtime. Conversely, a low PMP may suggest a reactive approach, leading to increased unplanned downtime and potential production disruptions.
15. Percentage Planned or Emergency Work Orders
This metric compares the percentage of planned maintenance work orders versus those that are emergency or unplanned.
Formula: Percentage planned vs. emergency maintenance work orders = (# of planned maintenance hours / # of unplanned maintenance hours) × 100
A higher percentage of planned work orders indicates effective maintenance planning, reducing disruptions and optimizing resources. Conversely, a higher percentage of emergency work orders suggests a reactive approach, potentially leading to increased downtime.
16. Unscheduled Downtime
Unscheduled downtime measures the duration equipment cannot perform as scheduled due to reliability or equipment issues. It reflects the effectiveness of maintenance plans and the impact on production schedules. High unscheduled downtime can result in lost revenue and customer dissatisfaction.
Formula: Unscheduled downtime = Sum of all unscheduled downtime during specified time frame
17. Downtime Analysis
Downtime analysis is expressed as a ratio, reflecting the time equipment is not operational in relation to its total operating time. This metric is crucial for understanding the overall efficiency of equipment. A higher ratio indicates more downtime, potentially leading to decreased productivity.
Formula: Downtime in proportion to operating time = Total time equipment is down: Total time equipment is in operation
Formula: Machine set-up time = Time required to prepare machine for next run
Efficiency KPIs For Production Managers
Efficiency manufacturing KPIs for production managers are designed to measure and evaluate the effectiveness and productivity of manufacturing processes. These metrics focus on the throughput, work in progress, schedule attainment, and overall equipment effectiveness to ensure optimal performance and resource utilization within a production environment. The KPIs included under efficiency manufacturing metrics are throughput rate, work in process, and overall equipment effectiveness.
19. Throughput Rate
Throughput rate is a key performance indicator measuring the product volume produced within a specified time frame. It provides insights into the efficiency and productivity of a manufacturing process, allowing for analysis and comparison of similar equipment, production lines, or entire manufacturing plants.
Formula: Throughput rate = Total number of good units produced / specified time frame
Work in process refers to goods in mid-production or awaiting completion and sale. This metric includes the raw materials, labor, and overhead costs associated with unfinished goods. WIP provides insights into the efficiency of material usage and the value of partially finished goods in production. A high WIP may indicate overproduction or inefficiencies in the production line, while a low WIP suggests efficient use of resources.
Formula: Work in process (WIP) = (Beginning WIP + manufacturing costs) – cost of goods manufactured
21. Overall Equipement Effectiveness(OEE)
OEE is a comprehensive metric that assesses the efficiency of equipment and machinery in the manufacturing process, considering factors such as availability, performance, and quality.
Formula: OEE = (Good Count × Ideal Cycle Time) / Planned Production Time
A high OEE indicates optimal equipment utilization and overall effectiveness in production. Conversely, a low OEE suggests potential issues in equipment efficiency, leading to increased downtime or reduced quality.
Conclusion
In conclusion, the role of a production manager is undeniably crucial in navigating the challenges of the manufacturing industry. It also ensures the transformation of raw materials into quality finished products. The multifaceted responsibilities of production managers can overlap with operations and quality managers. Thus, highlights the need for effective monitoring through KPIs. The top 5 KPIs for production managers discussed in this blog are performance, lean, quality, maintenance, and efficiency KPIs. They offer a comprehensive toolkit for production managers to gauge and optimize their operations.
By closely monitoring and optimizing these KPIs, production managers can steer their operations toward greater efficiency, improved quality, and enhanced competitiveness in the dynamic landscape of manufacturing. These KPIs for production managers serve as a compass, guiding them to make data-driven decisions, address challenges proactively, and ultimately contribute to their organizations’ overarching goals of profitability and scalability.
+
ERP Implementation Failure Recovery
Learn how Frederick Wildman struggled with Microsoft Dynamics 365 ERP implementation failure even after spending over $5M and what options they had for recovery.
Which KPIs are most critical for production managers in monitoring and improving efficiency?
The most critical KPIs for production managers revolve around performance, lean, quality, maintenance, and efficiency. Production/schedule attainment, changeover time, and takt time are essential performance KPIs. They offer insights into operational efficiency. While lean KPIs like cycle time and first pass yield focus on waste reduction and resource optimization. Quality KPIs such as yield, first time yield, and scrap rate provide a comprehensive view of product quality. Maintenance KPIs like MTBF and percentage maintenance planned help gauge equipment reliability. And efficiency KPIs like throughput rate and overall equipment effectiveness (OEE) measure productivity and workflow optimization.
How do performance manufacturing KPIs like production/schedule attainment impact a company’s bottom line?
Production/Schedule attainment directly influences a company’s profitability by quantifying the alignment between actual production and scheduled targets. A higher production attainment score indicates superior performance, demonstrating that the manufacturing process operates in sync with planned schedules. This alignment is crucial for meeting production goals efficiently and minimizing delays. Conversely, a lower production attainment percentage suggests inefficiencies, potential delays, and challenges within the manufacturing process, which can adversely impact the bottom line by affecting delivery timelines and customer satisfaction.
How can production managers use lean manufacturing KPIs like cycle time to enhance operational efficiency?
Lean manufacturing KPIs like cycle time play a pivotal role in enhancing operational efficiency. A lower cycle time indicates a streamlined process, allowing for faster response to production demands. Production managers can use cycle time insights to identify bottlenecks, streamline workflows, and improve overall efficiency. Conversely, a high cycle time suggests inefficiencies, potential delays, and a decreased ability to respond promptly to customer requests, impacting operational agility and competitiveness.
A skilled inventory manager is one who carefully balances customer satisfaction with efficient capital management. Inventory managers take on the central role, overseeing the seamless flow of goods, optimizing stock levels, and ensuring the availability of the right products at the right time. Their responsibilities span from managing warehouse operations to refining procurement strategies, all geared towards enhancing the company’s overall performance.
Assessing the effectiveness involves measuring the KPIs for inventory managers, which act as valuable metrics for evaluating the success of inventory-related processes. Precision and efficiency are paramount in inventory management, necessitating to track specific KPIs for inventory managers which can provide insights into various facets of their operations. These metrics not only pinpoint areas for improvement but also empower inventory managers to make informed decisions that positively impact the company’s bottom line.
The inventory turnover rate is one of the sales KPIs for inventory managers that measures the number of times a company’s inventory is sold and replaced over a specific period, usually a year. A high turnover rate indicates that products are selling quickly, which is beneficial for cash flow and minimizing the holding costs of unsold items. Conversely, a low turnover rate suggests slow-moving inventory, tying up capital and potentially leading to obsolescence. This KPI is crucial for an inventory manager as it reflects the efficiency of stock management, helping them adapt strategies to align with market demands and optimize capital usage.
Inventory turnover rate = cost of goods sold / average inventory
2. Days on Hand
Days on hand is a sales KPI that measures the average number of days or weeks it takes to sell the current inventory. A low value signifies quick inventory turnover, which is positive for cash flow and reduces holding costs. On the other hand, a high value may indicate overstocking or slow-moving products, leading to potential obsolescence and tying up capital. These KPIs are vital for an inventory manager as they provide insights into the balance between stock levels and sales velocity, enabling strategic adjustments to align with market demands.
Days of inventory on hand = (average inventory for period / cost of sales for period) x 365
3. Stock to Sales Ratio
The sales KPI for inventory managers that compares the amount of stock on hand to the current sales volume is known as the stock to sales ratio. A high ratio may indicate overstocking, tying up capital, and potentially leading to increased holding costs. A low ratio could suggest potential stockouts, impacting customer satisfaction and sales revenue. For an inventory manager, maintaining an optimal stock to sales ratio is essential for ensuring inventory aligns with sales demand, minimizing holding costs, and maximizing profitability.
Stock to sales ratio = $ inventory value / $ sales value
4. Sell-through Rate
The sell-through rate is responsible for measuring the percentage of available inventory sold during a specific period. A high sell-through rate indicates efficient sales, minimizing the risk of overstocking and reducing holding costs. Conversely, a low sell-through rate may signify slow-moving inventory, potentially leading to obsolescence. This KPI is crucial for an inventory manager as it guides decisions on product promotions, pricing, and inventory replenishment strategies to optimize sales and prevent overstock.
Sell-through rate = (# units sold / # units received) x 100
5. Backorder Rate
This sales KPI for inventory managers measures the percentage of customer orders that cannot be fulfilled immediately due to insufficient stock. A low backorder rate indicates efficient inventory management, enhancing customer satisfaction. Whereas, a high backorder rate may result in lost sales and dissatisfied customers. For an inventory manager, minimizing the backorder rate is crucial for meeting customer demand, retaining business, and optimizing sales revenue.
Backorder Rate = (# delayed orders due to backorders / total # orders placed) x 100
6. Accuracy of Forecast Demand
The accuracy of forecast demand, a sales KPI for inventory managers evaluates how closely the forecasted demand aligns with actual sales. High accuracy suggests effective forecasting, minimizing stockouts and overstock situations. On the other hand, low accuracy may lead to inefficient inventory levels and potential lost sales. This KPI is vital for an inventory manager as it influences purchasing decisions, warehouse operations, and overall inventory optimization, ensuring resources are allocated efficiently.
Accuracy of Forecast Demand = [(actual – forecast) / actual] x 100
The 2025 Digital Transformation Report
Thinking of embarking on a ERP journey and looking for a digital transformation report? Want to learn the best practices of digital transformation? Then, you have come to the right place.
The rate of return measures the percentage of sold items that are returned by customers. A low return rate indicates customer satisfaction and product quality. Conversely, a high return rate may suggest issues with product quality, leading to potential financial losses. For an inventory manager, monitoring the rate of return is crucial for maintaining customer satisfaction, identifying product issues, and implementing corrective measures to optimize sales and minimize returns.
8. Product Sales
Product sales is a sales KPI that represents the total units of a specific product sold within a given period. High product sales indicate strong market demand and successful product positioning and, low product sales may suggest the need for marketing adjustments or potential product obsolescence. This KPI is important for an inventory manager as it informs decisions on inventory replenishment, marketing strategies, and overall product lifecycle management.
9. Revenue per Unit
Revenue per unit calculates the average revenue generated by selling one unit of a product. High revenue per unit suggests effective pricing strategies and profitable product offerings. On the contrary, low revenue per unit may require pricing adjustments or a reevaluation of the product’s market positioning. For an inventory manager, understanding revenue per unit is crucial for optimizing pricing strategies, maximizing profitability, and making informed decisions about product offerings.
Revenue per unit = total revenue for period / average units sold for period
10. Cost per Unit
Cost per unit measures the average cost incurred to produce or purchase one unit of a product. Low cost per unit indicates efficient cost management, contributing to higher profit margins. Conversely, high cost per unit may impact profitability and require cost reduction strategies. For an inventory manager, monitoring cost per unit is essential for optimizing procurement strategies, negotiating with suppliers, and ensuring cost efficiency in the production or purchasing process.
Cost per unit = (fixed costs + variable costs )/ # units produced
11. Gross Margin by Product
Gross margin by product is a sales KPI for inventory managers which calculates the percentage of revenue retained after deducting the cost of goods sold for a specific product. A high gross margin indicates profitability, while a low margin may require a reevaluation of pricing or production costs. This KPI is vital for an inventory manager as it guides decisions on product pricing, procurement strategies, and overall product profitability, contributing to the company’s financial success.
Gross margin = [(net sales – cost of goods sold) / net sales] x 100
12. Gross Margin Return on Investment (GMROI)
Gross margin return on investment (GMROI), a sales KPI for inventory managers, evaluates the profitability of inventory investments by comparing the gross margin to the average inventory investment. A high GMROI indicates efficient use of capital and inventory profitability while a low GMROI may suggest the need for inventory optimization strategies. This KPI is essential for an inventory manager as it guides decisions on inventory investment, product assortment, and overall profitability, maximizing returns on capital employed.
Gross margin return on investment = gross margin / average inventory cost
Warehouse KPIs For Inventory Managers
13. Time to Receive
Time to receive is a warehouse KPIs for inventory managers which measures the average time taken to receive and store incoming inventory. A low time to receive indicates efficient warehouse operations, reducing the time products spend in transit. Conversely, a high time to receive may lead to delays in inventory availability. This KPI is important for an inventory manager as it impacts inventory replenishment speed, reducing the risk of stockouts and optimizing overall operational efficiency.
Time to receive = time for stock validation + time to add stock to records + time to prep stock for storage
14. Put Away Time
Put away time is a warehouse KPI for inventory managers that measures the average time taken to place received inventory into its designated storage location within the warehouse. A low put away time indicates efficient warehouse operations, reducing the time products spend in transition between receiving and storage. On the other hand, a high put away time may lead to delays in making inventory available for order fulfillment. This KPI is vital for inventory managers as it directly impacts the speed at which products become accessible for sale, minimizing the risk of stockouts and optimizing overall warehouse efficiency.
Put away time = total time to stow received stock
15. Supplier Quality Index
The supplier quality index is a warehouse KPI that assesses the quality of products received from suppliers. A high index indicates reliable and high-quality suppliers, reducing the risk of defects and returns. Conversely, a low index may suggest issues with product quality and supplier reliability. This KPI is crucial for an inventory manager as it influences supplier selection, inventory quality, and overall customer satisfaction, ensuring a seamless flow of high-quality products.
Supplier quality index = (material quality x 45%) + (corrective action x 10%) + (prompt reply x 10%) + (delivery quality x 20%) + (quality systems x 5%) + (commercial posture x 10%)
Operational KPIs For Inventory Managers
16. Lost Sales Ratio
The lost sales ratio is an operational KPI for inventory managers that measures the percentage of potential sales lost due to stockouts. A low lost sales ratio indicates effective inventory management, minimizing revenue loss. Whereas, a high ratio suggests the need for inventory optimization to prevent lost sales opportunities. This KPI is vital for an inventory manager as it highlights the impact of stockouts on revenue and guides decisions on inventory replenishment strategies.
Lost sales ratio = (# days product is out of stock / 365) x 100
17. Perfect Order Rate
Perfect order rate evaluates the percentage of orders that are fulfilled without errors. A high perfect order rate indicates efficient order processing and customer satisfaction. On the contrary, a low rate suggests issues with order accuracy, potentially leading to customer dissatisfaction and increased operational costs. This KPI is important for an inventory manager as it reflects the overall effectiveness of order fulfillment processes and guides improvements to enhance customer experience.
Perfect order rate = [(# orders delivered on time / # orders) x (# orders complete / # orders) x (# orders damage free / # orders) x (# orders with accurate documentation / # orders)] x 100
18. Inventory Shrinkage
Inventory shrinkage is an operational KPI for inventory managers that measures the loss of inventory due to theft, damage, or errors. A low shrinkage rate indicates effective security and inventory control measures. Conversely, a high rate suggests vulnerabilities in inventory management, impacting profitability. This KPI is crucial for an inventory manager as it guides decisions on security measures, inventory control, and loss prevention strategies, ensuring the integrity of the inventory.
Inventory shrinkage = ending inventory value – physically counted inventory value
19. Average Inventory
Average inventory calculates the average value of inventory during a specific period. A low average inventory suggests efficient stock turnover and capital usage. Whereas, a high average inventory may indicate overstocking and tie up capital. This KPI is vital for an inventory manager as it provides insights into the balance between stock levels and operational efficiency, guiding decisions on inventory optimization strategies.
Average inventory = (beginning inventory + ending inventory) / 2
20. Inventory Carrying Cost
Inventory carrying cost calculates the total cost of holding and storing inventory. A low carrying cost indicates efficient inventory management, minimizing expenses tied up in unsold stock while, a high carrying cost may suggest the need for inventory optimization to reduce financial impact. This KPI is crucial for an inventory manager as it influences decisions on inventory levels, storage solutions, and overall cost efficiency.
Inventory carrying costs = [(inventory service costs + inventory risk costs + capital cost + storage cost) / total inventory value] x 100
21. Customer Satisfaction Rate
Customer satisfaction rate measures the satisfaction of customers with the company’s products and services. A high satisfaction score indicates positive customer experiences, contributing to brand loyalty and, a low score may suggest areas for improvement to prevent customer dissatisfaction. This KPI is important for an inventory manager as it reflects the impact of inventory management on customer satisfaction, guiding improvements to enhance overall customer experience.
Customer satisfaction score = (# positive responses / # total responses) x 100
22. Fill Rate
Fill rate measures the percentage of customer orders fulfilled from available stock. A high fill rate indicates efficient order fulfillment, enhancing customer satisfaction. Conversely, a low fill rate may lead to backorders and customer dissatisfaction. This KPI is vital for an inventory manager as it guides decisions on inventory levels, order processing efficiency, and overall customer service improvement.
Fill rate = [(# total items – # shipped items) / # total items] x 100
23. Gross Margin Percent
Gross margin percent calculates the percentage of revenue retained after deducting the cost of goods sold. A high gross margin percentage indicates profitability, while a low margin may require adjustments to pricing or cost reduction strategies. This KPI is crucial for an inventory manager as it guides decisions on pricing strategies, procurement efficiency, and overall profitability, contributing to the financial success of the company.
Gross margin percent = [(total revenue – cost of goods sold) / total revenue] x 100
24. Order Cycle Time
Order cycle time measures the average time taken to fulfill a customer order from initiation to delivery. A low order cycle time indicates efficient order processing and quick delivery, enhancing customer satisfaction. Conversely, a high cycle time may lead to delays and customer dissatisfaction. This KPI is important for an inventory manager as it guides improvements in order processing efficiency, reducing lead times and optimizing overall operational performance.
Order cycle time = (time customer received order – time customer placed order) / # total shipped orders
25. Stock-Outs
Stock-outs measure instances where products are not available when customers demand them. A low occurrence of stockouts indicates effective inventory management, minimizing revenue loss and customer dissatisfaction. On the other hand, frequent stockouts may suggest issues with inventory optimization strategies. This KPI is vital for an inventory manager as it reflects the impact of inventory availability on customer satisfaction and guides decisions on inventory replenishment strategies.
Stock-outs = (# items out of stock / # items shipped) x 100
26. Service Level
Service level measures the percentage of customer demand that a company can fulfill. A high service level indicates effective inventory management, meeting customer demand, and enhancing satisfaction while a low service level may lead to lost sales and dissatisfaction. This KPI is crucial for an inventory manager as it guides decisions on inventory levels, order fulfillment strategies, and overall customer service improvement.
Service level = (# orders delivered / # orders received) x 100
27. Lead Time
Lead time measures the time taken from placing an order to receiving the inventory. A low lead time indicates efficient supply chain operations and quick product availability. Conversely, a high lead time may lead to delays in order fulfillment and potential stockouts. This KPI is important for an inventory manager as it guides decisions on supplier relationships, order planning, and overall supply chain efficiency.
Lead time = order process time + production lead time + delivery lead time
28. Dead Stock/Spoilage
Dead stock/spoilage measures the percentage of inventory that has become obsolete or spoiled. A low dead stock/spoilage rate indicates effective inventory management and minimizes financial losses. Whereas, a high rate may suggest issues with product demand forecasting or storage conditions. This KPI is vital for an inventory manager as it guides decisions on inventory levels, product lifecycle management, and overall inventory optimization.
Dead/spoiled stock = (amount of unsellable stock in period / amount of available stock in period) x 100
29. Available Inventory Accuracy
Available inventory accuracy measures the precision of inventory records in reflecting the actual available stock. High accuracy ensures reliable inventory information for decision-making while low accuracy may lead to errors in order fulfillment and operational inefficiencies. This KPI is crucial for an inventory manager as it guides decisions on inventory tracking systems, technology investments, and overall data accuracy, ensuring reliable information for optimal inventory management.
Available inventory accuracy = (# counted items that match record / # counted items) x 100
30. Internal WMS Efficiency
Internal WMS efficiency measures the effectiveness and accuracy of the internal warehouse management system. High efficiency ensures smooth warehouse operations and accurate inventory tracking. Conversely, low efficiency may lead to errors in order fulfillment and operational disruptions. This KPI is important for an inventory manager as it guides decisions on technology investments, system optimizations, and overall warehouse management, enhancing operational efficiency.
Internal WMS efficiency (ROI) = (gain on investment – cost of investment) / cost of investment
Conclusion
In conclusion, mastering the art of effective inventory management is essential for businesses. Skilled inventory managers play a central role in achieving this delicate balance between customer satisfaction and capital efficiency. The intricate responsibilities they shoulder, from overseeing seamless product flow to optimizing stock levels, contribute significantly to a company’s overall success.
Assessing the effectiveness of inventory management involves delving into KPIs for inventory managers. These are indispensable metrics that serve as a compass for evaluating the triumphs of inventory-related processes. These metrics serve not only to pinpoint areas for improvement but also to empower inventory managers with informed decision-making capabilities. Thus, ultimately influencing the company’s bottom line positively.
This blog has delved into the top 30 KPIs for inventory managers, categorized into three main dimensions: sales KPIs, receiving/warehouse KPIs, and operational KPIs. By comprehending and strategically leveraging these metrics, inventory managers can navigate the intricate landscape of inventory management. They can streamline processes, elevate customer satisfaction, and contribute substantially to the holistic success of the company.
+
ERP Implementation Failure Recovery
Learn how Frederick Wildman struggled with Microsoft Dynamics 365 ERP implementation failure even after spending over $5M and what options they had for recovery.
Why is the inventory turnover rate important for an inventory manager?
The inventory turnover rate is a crucial sales KPI for inventory managers as it measures the number of times a company’s inventory is sold and replaced over a specific period. A high turnover rate indicates efficient stock management, benefiting cash flow and minimizing holding costs. Conversely, a low turnover rate suggests slow-moving inventory, tying up capital. This KPI helps inventory managers adapt strategies to align with market demands and optimize capital usage.
What does the lost sales ratio indicate, and why is it important for inventory managers?
The lost sales ratio is an operational KPI that measures the percentage of potential sales lost due to stockouts. A low ratio indicates effective inventory management, minimizing revenue loss. A high ratio suggests the need for inventory optimization to prevent lost sales opportunities. This KPI is vital for inventory managers as it highlights the impact of stockouts on revenue and guides decisions on inventory replenishment strategies.
How does internal WMS efficiency (ROI) contribute to effective inventory management?
Internal WMS efficiency measures the effectiveness and accuracy of the internal warehouse management system. High efficiency ensures smooth warehouse operations and accurate inventory tracking. This KPI is important for inventory managers as it guides decisions on technology investments, system optimizations, and overall warehouse management, enhancing operational efficiency and contributing to effective inventory management.
ERP selection and ERP implementation are significant business initiatives for any organization. It’s a journey that involves numerous steps, each of which plays a critical role in determining the success of your ERP project. Often underestimated in their importance, the initial phases of the ERP selection set the stage for what follows. They form the backbone of your ERP implementation and can either pave the way for a seamless transition or introduce complex challenges that may threaten the ERP project’s success.
This blog delves into the essential ERP selection inadequacies and how they impact ERP implementation. By understanding the intricate link between ERP selection and ERP implementation, you can optimize the value of your ERP system while minimizing potential risks and pitfalls. Therefore, here are the top 5 ERP selection inadequacies and the issues they create for the ERP implementation phase. This explains why ERP selection and ERP implementation can’t be siloed initiatives.
1. Project Initiation
The ERP selection begins with project initiation, marked by a kickoff meeting and the creation of a project charter and stakeholder matrix. This initial phase sets the foundation of the ERP project. The project charter defines the project’s vision, goals, and KPIs for as-is and to-be states. It also establishes a budget and timeline, with the lack of which is a common mistake. Clear vision and goals lead to the creation of a stakeholder matrix, outlining roles, decision-making processes, and responsibilities. Hence, fosters accountability, supported by a core team, steering committee, and communication plan. Once the alignment is achieved, subsequent discovery workshops are conducted to collect and analyze data structures.
Issues of Inadequate Project Initiation
One of the major ERP selection inadequacies that are persistent in ERP projects is inadequate project initiation. Being the very first step of the ERP project it lays the foundation and can also be the reason for a million-dollar disaster if not done right. Here are some of the issues that inadequate project initiation might create for you:
Executives overpowering: Executives overpowering in ERP implementation can lead to uninformed decisions as they may lack a detailed understanding of ground-level issues, particularly causing disruptions and inefficiencies in the implementation process.
Vague objectives: Vague objectives, such as a generic desire for a “fully integrated system” without specific definitions or budget constraints, can hinder ERP implementation by leading to misunderstandings and unrealistic expectations.
The 2025 Digital Transformation Report
Thinking of embarking on a ERP journey and looking for a digital transformation report? Want to learn the best practices of digital transformation? Then, you have come to the right place.
After completing the discovery phase, you’ll have a comprehensive set of requirements across various divisions. It’s crucial to assess existing systems to meet these needs and designate future systems for the task. Although, this shapes your enterprise architecture and workflow interactions, some ERP selection processes overlook this. Assuming ERP is a one-size-fits-all solution. Therefore, to avoid this host your requirements where they align, adhering to architectural and master data governance guidelines.
Requirement workshops review each need, ensuring an understanding of the as-is and to-be state. The team defines process boundaries and agrees on critical success factors, serving as a secondary validation to avoid omitting essential requirements. Therefore, critical success factors are critical needs that can make or break your ERP selection and ERP implementation. Organizations often focus on non-critical specifics, diverting from vital elements.
Issues of Inadequate Requirements Workshop
Requirements workshop is the very next step after the discovery phase, which is often overlooked by businesses. If not performed thoroughly, this can turn out to be one of the ERP selection inadequacies that can lead to misalignment with the business need. Therefore, here are some of the potential issues that inadequate requirements workshops might create for you:
Vague in defining requirements: Lack of expertise in defining requirements for ERP implementation can lead to vague and insufficiently detailed specifications. Critical assumptions can cause issues in system integrations particularly because vague expectations may have diverse interpretations. It may not align with with the specific needs of the business which is the primary objective of any ERP project.
Challenges in system use and reconciliation: Lack of expertise in identifying critical success factors in ERP implementation can lead to overlooking deeper implications, such as poor data models and financial control issues. It can ultimately cause challenges during system use and reconciliation.
System bias: Not defining requirements can often lead to system bias in ERP implementation, as individuals may base requirements on prior experiences with different systems. It can potentially overlook the unique aspects of the new model and rendering critical success factors invalid.
3. Business Process Re-engineering
In ERP selection, business process re-engineering is crucial, mostly influenced by current processes and desired outcomes. Skipping this phase due to cost concerns may often lead to technical overengineering and adoption challenges. An ERP consultant’s expertise is always advisable for assessing processes, even without extensive documentation. Process visualization is vital in this step, considering users’ varied ERP knowledge. This is to ensure clear expectations without contractual commitments.
This phase involves creating BPR maps and aligning processes with enterprise software in a vendor-agnostic way. The goal is to achieve an ERP dictionary-compliant state. Therefore, a detailed analysis is required to determine which processes need restructuring and the impact on information models and architecture. A rollout plan is often needed to follow an iterative approach, allowing for the gradual phase-out of legacy transactions and processes. This step is crucial in balancing stakeholder perspectives. While BPR prevents overengineering and meeting diverse users, the technical team often requires dual maps—user-centric and implementation-focused. Managing the as-is version internally and crafting impactful to-be maps demands specialized ERP implementation experience.
Issues of Inadequate Business Process Re-Engineering
Business process re-engineering is often not focused upon by most companies as it is thought to be a step that doesn’t require much expertise. This often leads to it being one of the ERP selection inadequacies that might result in several ERP implementation issues. Here are some of the issues that you might face:
Modeling broken processes: Lack of expertise in business processes during ERP implementation can lead to misconceptions, with individuals treating processes as simplistic and overlooking the need for expert knowledge. This results in modeling broken processes as requirements are misidentified.
Potential overengineering and integration issues: Lack of expertise in persuasion can hinder ERP implementation by impeding the ability to effectively communicate and justify necessary changes. This might lead to resistance from different departments, potential overengineering, and integration issues.
Challenges in ERP adoption: Relying on technology as a magic solution, without acknowledging the need for proper implementation and alignment with business processes, can lead to significant challenges in ERP adoption.
Misconceptions about processes: Lack of expertise in data during ERP implementation can lead to misconceptions about unique processes, as processes might be influenced by flawed data. Companies often rely on technical teams for data modeling, but these teams may lack the necessary business expertise, resulting in significant implementation challenges.
4. Data Re-engineering
In ERP selection, data re-engineering is often underestimated by 90% of companies, risking unnecessary complexities. Thorough data analysis and gap analysis are essential to identify areas requiring re-engineering. This process involves crucial layers like master data governance, and understanding intricate relationships between data hierarchies, processes, and system decisions. Maintaining master data integrity, especially when shared externally, is challenging but crucial for successful ERP implementation.
When we talk about master data governance, it goes beyond a system concept. It necessitates the definition of organizational workflows that transcend enterprise boundaries. This involves establishing data origination, maintenance responsibilities, and augmentation procedures. A source of authority matrix for each dataset is crucial in this process. Additionally, the implementation of reconciliation workflows is vital for analyzing transactional data reconciliation across system boundaries, identifying underlying issues in GL reconciliation scenarios, and informing decisions about process and system boundaries during ERP implementation.
Issues of Inadequate Data Re-engineering
ERP selection inadequacies might also occur when data re-engineering is ignored during the selection phase. This might happen due to the preconceived notion that this is a critical step in ERP implementation. It is a debatable topic as some might think this to be a practical decision whereas it might also lead to increased workload in some cases. Here are some issues that might occur due to inadequate data re-engineering:
Negative impact on process and system regeneration: Confusion between conducting data re-engineering in the ERP selection or implementation phases can be similar “chicken-and-egg who came first” problem. Delaying this critical step until the implementation phase may seem practical due to uncertainties in system selection. However, overlooking data re-engineering during selection can result in surprises, impacting both process and system regeneration, becoming a common challenge in ERP implementation.
Increased workload and failed automation efforts: Lack of experience in data-centric systems can lead to challenges in understanding and analyzing data flows within ERP implementations. It often results in unintended consequences such as increased workload, failed automation efforts, and compromised customer experience.
5. Enterprise Architecture Development
In ERP selection, developing enterprise architecture is crucial. This step assesses existing and new systems to establish the as-is and to-be states of data flow. It identifies department workflows, user transaction execution, and reconciliation processes to align business and technical teams.
Mapping user and department workflows is a key task in this step. It goes beyond primary system identification, extending to secondary and tertiary systems for root cause analysis. This system-level view is category-focused and independent of specific technologies. The next significant task is high-level design. It delineates component roles, responsibilities, and significant system messages. Unlike detailed technical aspects, it offers a broad view, aiding technical teams in understanding business outcomes. Following this, detailed design takes the spotlight. Technical teams craft specifications based on the high-level design, addressing intricacies such as error handling. This phased approach ensures a comprehensive understanding and alignment between business and technical aspects in the ERP selection phase.
Issues of Inadequate Enterprise Architecture Development
Having an unclearly defined enterprise architecture may often lead to one of the most critical ERP selection inadequacies. This is a common mistake made by businesses during ERP selection. ERP systems may not give the desired results due to the lack of a clear definition of the architecture. Here are some of the issues that might be created due to inadequate enterprise architecture development:
Over engineer ERP systems: Overengineering the ERP system due to a lack of a clearly defined enterprise architecture and data model can lead to hosting diverse requirements within ERP. This can cause an overload on specific systems (e.g., e-commerce or POS) and hinder the overall understanding of data flow implications across the architecture.
Misalignment between technical efforts and user expectations: Delaying technical decisions in ERP implementation by deferring architecture development may result in technical teams discovering obstacles in building the model. This is because critical assumptions were not thoroughly examined during the selection phase. It can also lead to a misalignment between technical efforts and user expectations. Users may find the implemented solution does not align with their needs, causing dissatisfaction and potentially requiring significant rework.
Hinders the alignment of system design with business needs: Lack of business perspective in ERP implementation can lead to a technical-centric focus, causing disinterest among business stakeholders. This hinders the alignment of system design with business needs and may result in implementation challenges.
Conclusion
While paving through the journey of ERP selection and implementation, recognizing the symbiotic relationship between these phases is very important. The decisions made during selection lay the foundation for a successful implementation. Similarly, the presence of one too many ERP selection inadequacies can also lead to failed ERP implementation. The careful alignment of your ERP system with your organization’s needs, the establishment of clear objectives, consensus among stakeholders, and the groundwork of efficient processes and reliable data ensure that the implementation phase is built on a solid base.
On the other hand, underestimating the importance of thorough work during selection can lead to costly and risky challenges during ERP implementation. The realization of this connection underscores the importance of a well-executed selection phase, which, in turn, guarantees a smoother, cost-effective, and less risky implementation process. This list of issues aims to offer you an overview of the interdependence between ERP selection and implementation, for you to discuss further with your independent ERP consultant.
+
ERP Implementation Failure Recovery
Learn how Frederick Wildman struggled with Microsoft Dynamics 365 ERP implementation failure even after spending over $5M and what options they had for recovery.
What is the significance of project initiation in ERP selection, and how can it be a potential inadequacy?
Project initiation is crucial in ERP selection, defining the project’s vision, goals, and KPIs, along with roles and responsibilities. The lack of clear accountability, executive overpowering, and vague objectives during this phase can lead to ERP selection inadequacies, risking challenges in later implementation stages.
Why is the requirements workshop essential in ERP selection, and what issues may arise if not conducted thoroughly?
The requirements workshop, following the discovery phase, ensures a comprehensive understanding of needs and critical success factors. Inadequate workshops may result in vague requirements, challenges in system use and reconciliation, and system bias, impacting the alignment with business needs during ERP implementation.
How does business process re-engineering impact ERP selection, and what issues might arise if not given proper attention?
Business process re-engineering is crucial for aligning processes with desired outcomes. Inadequate focus may lead to modeling broken processes, potential overengineering, challenges in ERP adoption, and misconceptions about processes, impacting the success of ERP selection and implementation.
What is inventory? Inventory can be anything that has a financial value. It can be a product or a service. It is anything and everything that goes on your sales order or purchase order. Now, the second task is to manage your inventory efficiently. Before you know about efficient ERP inventory management best practices, let’s discuss the importance of coded inventory i.e. SKUs.
The Importance of Coded Inventory
So, when you look at your sales order, there will be a bunch of headers and product lines. The product lines are entered by SKUs. The whole idea of SKU is that once you have the ID, you grab the whole product information. You are bundling every single piece of information related to that product under that SKU.
Now, when you look at SKU, obviously there will be SKU numbers along with a lot of different layers. These layers can be either dependent or independent. Let’s understand this with an example. Suppose we have four different SKUs – 1100, 1101, 1102, and 1103 which are independent. Each SKU will further have multiple data points. Suppose the SKU number 1100 has 2000 different data points. What are these data points on the inventory level? These data points are going to be everything that defines that particular inventory, for example, a lot number.
The whole intent of keeping information bundled up is to make sure that your data entry is simplified. Let’s say you want to use this product anywhere in your system or any process. There are going to be 1000 to 2000 data points associated with each SKU. It could be weight, dimension, lot number, or any other attribute related to the product. If you have to enter 2000 different data points, you are going to go crazy. Therefore, you need some sort of description of your inventory that you can grab quickly.
The 2025 Digital Transformation Report
Thinking of embarking on a ERP journey and looking for a digital transformation report? Want to learn the best practices of digital transformation? Then, you have come to the right place.
The way you model these SKUs defines what result you are going to get out of your ERP. Therefore, product modeling is very critical here. Now that we have cleared the basics, let’s dive into types of inventory. There are three kinds of inventory: dimensional inventory, piece inventory, and matrix inventory. Understanding each of them is important as it will make both your ERP selection and ERP implementation easier. Using an ERP system that does not support any one type of inventory might result in planning issues. It might also result in ad-hoc processes and increased admin effort in correlating dimensions on top of raw data.
1. Matrix Inventory
Let’s understand this concept with an example. Suppose there are two shoes and the only difference in the production perspective between them is the pigment used. One is black and the other is red. The way the manufacturing process works is how you organize the information. You reutilize as much as possible. The more you reutilize, the more financial efficiencies you are going to get from the process. So, these shoes could be manufactured in the same way as all their pieces except when it comes to mixing the pigment. But suppose now you want to change the assembly process for the black shoe.
You have to probably go to every black shoe variant and change this information as the data is not interconnected. This becomes a huge problem in industries like fashion and apparel where the demand is driven by style, season, etc. That’s where matrix inventory comes in handy. The whole intent of matrix inventory is to reutilize the information as much as possible by organizing it differently. As the name suggests it is planned exactly like a matrix.
The base SKU remains the same, but you can have other attributes like color, size, etc related to it. Because of this reason, the data related to the SKU is interconnected. So anytime there is going to be a change in the foundational SKU you are not necessarily going to multiple places and changing that.
2. Dimensional Inventory
The problems and intent of dimensional and matrix inventory are very much similar with few differences. Let’s understand this with two examples. So, whenever you go to a grocery store, you can scan a barcode and it gives all the details of the SKU. Let’s say you have chicken in the meat section of the store. Chicken no. 1 with SKU 1101, chicken no. 2 with SKU 1102, etc. These are very similar chickens with the only difference of the dimension – weight. Now, if the SKU of these chickens is not blended with the dimension weight, you cannot sell it. This is because you need to know this information while packaging when sold and charge the customers accordingly.
Now, for the second example. Let’s say you have a sheet metal and you are trying to cut it into different pieces of different dimensions for car manufacturing. The sheet metal will have an SKU, and so will each of its parts. But just the SKU won’t be enough and you are going to need some sort of attributes to be able to plan at the attribute level. So you are going to create some sort of attribute here, like heat number, and plan the inventory accordingly. It is similar to how the matrix inventory works in the retail industry but won’t have as many permutations and combinations as there are in retail.
3. Piece Inventory
Piece inventory comes in continuation of the dimensional inventory. Let’s take the same example of the sheet metal mentioned above. Now let’s say after entering the dimensions, you need the machine to cut the sheet metal into ten different pieces. But logically the machine can only cut the sheet metal into twelve pieces and not ten. So now, you have to decide what you do with those two pieces. What are the possibilities? One possibility is that you can simply throw it in the scrap. If you throw there is a financial value attached to it, which will make your pieces far more expensive. Another possibility could be you put these two extra pieces for some next job. Now this decision might create friction as it affects the entire production line.
This is where piece inventory should be planned. What do you do with these pieces? How do you organize these pieces? There is a functionality inside ERP in which once pieces are recognized, you have some flexibility in how they will be accounted for. So when you define this nesting process, the system already knows that it is going to create these two extra pieces. So whatever you define in this part of the algorithm, you can define them in advance so that you don’t have to impact your production process.
ERP Inventory Management Best Practices
Now that you know the difference between these three types of inventory it will help you design your inventory accordingly. Based on the industry types this will help in devising the ERP inventory management best practices for maximum financial efficiency. Below are the top 4 ERP inventory management best practices that you should always keep in mind before you design your inventory.
1. Mimic The Physical Process
Designing inventory systems that closely mirror the physical manufacturing process is one of the fundamental ERP inventory management best practices. By aligning the digital representation of inventory with its real-world counterpart, you can ensure seamless integration and a more accurate reflection of your operational reality. This strategy involves breaking down the manufacturing process into modular components, just as you would in the physical production of goods.
The goal here is to replicate and optimize the flow of materials and products throughout the entire supply chain. By doing so, you can identify bottlenecks, streamline workflows, and maximize resource utilization. This approach not only enhances efficiency but also minimizes discrepancies between digital records and the actual state of inventory, ultimately leading to more accurate forecasting and planning.
2. Balancing Data Entry
Balancing data entry from the user’s perspective is one of the critical ERP inventory management best practices. It ensures the accuracy and reliability of inventory information. While it’s essential to capture comprehensive data for each inventory item, a balanced approach avoids unnecessary complexity that may arise from overloading the system with redundant information. Prioritizing user-friendly data entry methods not only reduces the risk of errors but also enhances the speed of data input.
You should aim to strike a balance between collecting essential information for effective inventory management and ensuring that the data entry process remains intuitive for users. This strategy helps maintain data accuracy, streamlines processes and facilitates smoother collaboration among your teams involved in inventory management.
3. Expert Review of SKU Design
Engaging independent ERP consultants to review and optimize your SKU design aligned with ERP planning is one of the most effective ERP inventory management best practices. SKU design goes beyond mere identification codes; it involves structuring product information in a way that aligns with the broader goals of the ERP system. Subject matter experts in the field can provide valuable insights into industry best practices, ensuring that SKU design maximizes the capabilities of the ERP platform. This strategy involves considering not only current operational needs but also anticipating future requirements. Through expert review, you can fine-tune your SKU design to enhance scalability, flexibility, and overall adaptability to evolving market demands.
4. Multiple Rounds of Testing During ERP Implementation
Conducting multiple rounds of testing during the ERP implementation is considered crucial as one of the ERP inventory management best practices. This process involves simulating real-world scenarios to ensure that the inventory module functions effectively and aligns with the specific needs of the business. Testing helps identify potential issues, discrepancies, or inefficiencies before the system is fully deployed, reducing the risk of disruptions to day-to-day operations.
Independent ERP consultants play a critical role in this strategy by leveraging their knowledge to anticipate future requirements and forecast potential risks. Rigorous testing not only validates the functionality of the inventory module but also provides valuable insights into system performance, helping you to make informed decisions and adjustments before the ERP system becomes an integral part of your operational infrastructure.
Conclusion
If you are looking to implement ERP inventory management best practices, you must understand the type of inventory you need to design based on your industry. Each of them has its own merits when utilized efficiently for the desired results from the ERP systems. The whole intent here is to figure out what is the best way to organize the SKUs of your inventory. Understanding these concepts will also help reduce manual data entry, which reduces time spent on SKU maintenance and ultimately helps increase the financial margins. This list aims to offer potential options for your further evaluation with independent ERP consultants.
+
ERP Implementation Failure Recovery
Learn how Frederick Wildman struggled with Microsoft Dynamics 365 ERP implementation failure even after spending over $5M and what options they had for recovery.
What is the significance of SKUs in ERP inventory management?
SKUs, or stock keeping units, serve as unique identifiers for products within a sales or purchase order. They consolidate comprehensive product information, streamlining data entry and simplifying inventory organization. Utilizing SKUs enhances efficiency, reduces data entry complexities, and ensures quick retrieval of necessary information for various business processes.
How does matrix inventory benefit industries like fashion and apparel?
Matrix inventory facilitates efficient production planning by organizing product information in interconnected matrices. For industries driven by style and seasonal demands, such as fashion and apparel, matrix inventory allows for the reuse of information. This minimizes the need for repetitive data entry when making changes to foundational SKUs, addressing challenges associated with varying product attributes like color and size.
Why is conducting multiple rounds of testing crucial during ERP implementation for effective ERP inventory management?
Conducting rigorous testing during ERP implementation is vital to simulate real-world scenarios, identify potential issues, and ensure the seamless functionality of the inventory module. This proactive approach helps mitigate risks, reduces the likelihood of disruptions to daily operations, and provides valuable insights for making informed decisions and adjustments before the ERP system becomes an integral part of your operational infrastructure.
What Is NetSuite ERP? NetSuite ERP is a powerful cloud-based ERP solution that empowers small to mid-sized businesses looking for a diverse cloud-native option particularly relying on add-ons for deep operational capabilities. Offering core ERP capabilities relevant to many industries, NetSuite ERP especially caters to modules spanning financial management, distribution, CRM, and supply chain management.
With the data model being friendly it is uniquely strong for industries especially hospitality, retail, and commerce-centric industries. In comparison with other cloud-native solutions that might be either weaker in their deep operational or broader capabilities, NetSuite ERP provides the best of both worlds for diverse organizations seeking a scalable solution that could scale with their business model and global growth.
The 2025 Digital Transformation Report
Thinking of embarking on a ERP journey and looking for a digital transformation report? Want to learn the best practices of digital transformation? Then, you have come to the right place.
NetSuite ERP has a robust capability to handle operations across 200 subsidiaries. Thus, proves to be a testament to its prowess in global expansion. The platform provides centralized control, enabling businesses to efficiently manage operations in various countries or subsidiaries in one database. NetSuite’s multi-entity support ensures that businesses can manage diverse entities with distinct financial structures seamlessly. Companies with multiple subsidiaries find value in the centralized control offered by NetSuite ERP especially fostering efficiency in managing operations across borders.
2. Deep Finance Capabilities
NetSuite ERP solution incorporates vital functionalities, particularly record-to-report (R2R), procure-to-pay (P2P), order-to-cash (OTC), fixed asset management (FAM), and services resource planning (SRP). Thus, providing the basic ERP capabilities for most industries, which need to be augmented by the add-ons provided through third-party add-ons. R2R ensures accuracy in financial reporting, P2P optimizes procurement processes, OTC manages the entire sales cycle, FAM efficiently handles fixed assets, and SRP enhances service-oriented businesses.
3. Best for Audit-ready SMBs
Role access control is a pivotal aspect of NetSuite ERP, offering companies the ability to define and manage user roles for audit-ready SMBs. The audit layers might not be as intuitive as larger ERP systems that might provide visual transactional maps but NetSuite ERP provides enough details for SMBs with the log of changes with each business object for easier traceability.
4. Scalable Solution for SMBs
Due to its diversified support for most business models that could also be augmented through the marketplace, it might take a while before SMBs outgrow NetSuite. The solutions that target specific business models or processes struggle with businesses that might be growing faster or might be active with M&A cycles.
5. eCommerce Friendly
NetSuite ERP demonstrates suitability for retail companies, with the marketplace options prevalent with eCommerce-centric operations and data models aligned for these companies, especially when it comes to integration options with many different channels and omnichannel architecture. However, cautionary notes arise for medical device companies, where user experiences highlight potential limitations in meeting specific industry needs. Industry-specific recommendations emphasize the importance of considering NetSuite ERP based on the unique requirements of each business.
6. Strong CRM Capabilities
Businesses benefit from a seamless CRM integration, especially if they are not planning to use a third-party best-of-breed solution, for which the integration might be cost-prohibitive. The Netsuite CRM can support several advanced capabilities, such as territory planning sales comp for complex channels, capabilities commonly found in mature CRM systems.
7. Vibrant Marketplace
NetSuite ERP has perhaps the most vibrant marketplace across the ecosystems, especially friendly for their core industries. Most cloud-native ISVs, such as vendor collaboration, WMS, or TMS software that might not be available with other ERP ecosystems, are available with NetSuite. This is a huge plus for businesses with diversified business models or companies that might have expectations to diversify in the near future as part of their growth.
8. Weaker for Industrial Companies
NetSuite’s manufacturing functionality comes under scrutiny, with user feedback expressing concerns about perceived depth. User concerns have shed light on potential limitations, prompting considerations for businesses with manufacturing needs. Businesses with manufacturing requirements need to carefully evaluate NetSuite ERP’s capabilities to ensure they align with the depth and complexity demanded by their operations.
Sourcing and Procurement: It has a centralized supply portal that ensures compliance in the purchasing process. It also includes forecasting abilities that can recalculate predictions based on actual fluctuations.
Warehouse Management: It streamlines warehouse operations, decreasing overhead and cycle times. This feature also enhances on-time delivery rates, improving customer retention and boosting revenue.
Production Management: This feature has basic production management capabilities, ideal for assembly-centric operations. It can be augmented by more mature solutions through third-party add-ons for richer industrial capabilities.
Accounting: It has comprehensive accounting features, covering invoicing, forecasting, and aiding in tax calculations based on factors like location and revenue.
Pros and Cons of NetSuite ERP
Pros
Cons
1. Ideal for SMBs operating in many countries.
1. Not fit for companies operating only in a few countries. Also, those looking for deeper operational capabilities provided as part of the suite and owned by OEM.
2. Cloud-native technology provides richer cloud capabilities, such as enterprise search and mobile capabilities, that might be weaker than other solutions.
2. Not the best fit for companies for which operational capabilities might be a bigger critical success factor than cloud-native features.
3. Ideal for publicly traded and audit-ready companies because of the built-in SOX compliance capabilities.
3. Not ideal for startups with simpler operating models. They might find audit-centric and deep financial capabilities over-bloated.
4. Ideal for service-centric SMBs because of the integrated PSA, HCM processes, and subscription billing.
4. Not fit for industrial companies looking for deep operational capabilities built as part of the core solution.
5. Ideal for eCommerce-centric SMBs because the pre-integrated add-ons and data models are friendlier for these industries.
5. Not fit for companies deep into B2B workflows because the pricing, discounting, and product models are not scalable.
6. Ideal for holding and private equity companies looking to host diverse business models on one solution.
6. Not fit for companies without expected changes in the business model in the near future.
7. Ideal for companies looking for talent available in most countries.
7. The experience with support might vary depending on the vendors involved with the engagement.
8. Ideal for companies looking to find best-of-breed tools and can’t replace edge solutions mandated by the OEM.
8. Not fit for companies seeking OEM-owned integration with core operational systems such as CAD or PLM.
Conclusion
In summary, NetSuite ERP stands as a robust and versatile cloud-based ERP solution. It provides businesses with the automation and centralization needed for efficient operations. Offering a comprehensive suite of functionalities, from financial management to distribution and CRM, NetSuite ERP proves flexible and adaptable.
However, careful consideration is crucial, particularly for businesses with complex operational needs. NetSuite’s strengths in global expansion, core functionalities, CRM capabilities, third-party integrations and add-ons make it an excellent choice for SMB businesses. Especially in the retail, hospitality, and service-centric industries. Yet, users must navigate potential pitfalls, such as limited operational capabilities, reliance on third-party add-ons, and challenges for smaller implementations. In evaluating NetSuite ERP, understanding its key features, pros, and cons becomes imperative. This ensures alignment with the unique operational requirements of each business. This NetSuite ERP independent review intends to provide you with unbiased insights for further discussion with your independent ERP consultants.
+
ERP Implementation Failure Recovery
Learn how Frederick Wildman struggled with Microsoft Dynamics 365 ERP implementation failure even after spending over $5M and what options they had for recovery.
How does NetSuite ERP support businesses in achieving global expansion, and what advantages does it offer?
NetSuite ERP is instrumental in facilitating global expansion by efficiently handling operations across 200 subsidiaries. This capability provides centralized control, fostering efficiency for businesses managing operations in various countries or subsidiaries.
What factors contribute to NetSuite ERP being scalable for SMBs?
Due to its diversified support for most business models that could also be augmented through the marketplace, it might take a while before SMBs outgrow NetSuite. The solutions that target specific business models or processes struggle with businesses that might be growing faster or might be active with M&A cycles.
What makes NetSuite ERP a powerful solution for businesses?
NetSuite ERP is a robust cloud-based solution automating processes across diverse industries. With comprehensive functionalities spanning financial management, distribution, CRM, and supply chain management, it offers flexibility, adaptability, and a relatively low cost of ownership.
ERP pricing implementation is not as easy. It brings forth many challenges. Some of them include managing and integrating vast amounts of pricing data, ensuring pricing consistency across various platforms, keeping pricing information up-to-date in real time, staying compliant with industry regulations, and so on. The list goes on. When it comes to pricing, ERP systems have several business rules at various levels. And understanding the nuances of these layers is crucial for pricing to work as your expectations.
When we talk about ERP pricing implementation, it helps in supporting complex pricing structures and provides the users with the most accurate experiences. It creates a seamless experience between operations and customer experiences. Enabling ERP pricing implementation means customers are receiving the most accurate pricing data that helps them with their purchase decisions. Businesses also gain the freedom to tier their pricing and discounts catered to certain customers and manage their sales. This blog delves into the top 10 ERP pricing implementation considerations.
The 2025 Digital Transformation Report
Thinking of embarking on a ERP journey and looking for a digital transformation report? Want to learn the best practices of digital transformation? Then, you have come to the right place.
While ERP pricing implementation, one of the critical factors that can significantly impact the integration is the intricacy of your product portfolio. For example, a company will face multiple challenges if it has a diverse product range. The need for multiple pricing tiers arises when dealing with various products, especially customizable ones. In this case, the company will have to publish the pricing in the market configure pricing in the ERP system, and e-commerce pricing. The result will be a complex web of pricing structures, leading to confusion in customer-facing situations.
The customer’s ordering experience will become a puzzle. This is because pricing depends on the channel through which the opportunity flows into the system. This will create challenges in managing repeat orders and introduce manual processes, making consistency a rare commodity. The lesson learned here is clear. When navigating the ERP pricing implementation, it’s crucial to streamline and simplify your product portfolio.
Strategies to Simplify Product Portfolios
Assess the performance of each product, identify the top-performing products, and consider phasing out those that contribute minimally to revenue.
Concentrate on your core products that align with your brand identity and meet the primary needs of your target audience.
Identify and eliminate redundant or overlapping products that serve similar purposes.
Listen to customer feedback and analyze demand patterns. Use this information to prioritize products that are in high demand.
Regularly review the lifecycle of each product. Consider discontinuing products that are at the end of their lifecycle and invest in innovation for new ones.
Create bundled offerings or packages that group related products together. This not only simplifies the purchasing decision for customers but also helps in promoting specific product combinations.
2. Pricing Dynamics
When we talk about pricing dynamics, several factors come into play, each influencing the cost structure and strategies employed by distributors and manufacturers. Understanding and navigating these diverse pricing dynamics are crucial during ERP pricing implementation. This understanding enables effective configuration of the ERP systems to accommodate different pricing structures. It also helps align them with the specific needs of the business. It also ensures pricing data accuracy and consistency within the ERP system. Businesses can adopt more customer-centric pricing strategies when they understand the pricing dynamics properly. They stay adaptable to market changes or shifts in demands and competition.
Key Dimensions in the Pricing Equation
Base Pricing. The foundation of any pricing strategy is the base pricing set by the distributor or manufacturer. This serves as the initial benchmark for products, reflecting their inherent value and influencing subsequent pricing adjustments.
Warehouse-Based Pricing. Introducing another layer of complexity, warehouse-based pricing depends on the geographical location of a warehouse. The same product may be priced differently based on the region or country where the warehouse is situated. This dynamic is driven by logistical considerations, regional cost variations, and market demands specific to each location.
Customer-Based Pricing. Adopting a customer-based approach, products are priced differently depending on the target audience. For retail customers, prices factor in elements like demand, competition, and perceived value for end consumers. Distribution customers, purchasing in bulk, face a different pricing structure. Manufacturers or distributors need to consider providing margins to accommodate the larger volumes bought by distributors, aligning pricing strategies with the distinct needs and purchasing behaviors of various customer segments.
Seasonal or Event-Based Pricing. Introducing a temporal dimension to the pricing equation, seasonal or event-based pricing strategies mean products may be priced differently during specific seasons, festivals, or events. This reflects the fluctuating demand and market dynamics tied to these timeframes.
3. Forms of Discounting
Discounting serves as a strategic layer atop the pricing structure, offering businesses a nuanced approach to adjust product costs and respond to various market dynamics. The ways that different forms of discounting affect the ERP pricing implementation are similar to how the pricing dynamics affect it. But there are some additions to it. Understanding this concept also helps businesses optimize costs in response to regional market demands. It helps in customer segmentation for more personalized and effective pricing.
Key Dimensions in the Discounting Framework
Base Discount. Applying a percentage reduction to the foundational base pricing, the base discount serves as a dynamic tool. It allows businesses to maintain a clear baseline for product values while introducing flexibility and responsiveness to market conditions, ensuring competitiveness without compromising perceived product value.
Location-Based Discounts. Providing an additional dimension to the discounting framework, location-based discounts optimize costs in response to regional market demands. These discounts tailor pricing strategies to specific warehouse locations, addressing pricing variations influenced by logistical, operational, or market-specific considerations.
Customer-Based Discounts. Extending adaptability to different customer segments, customer-based discounts cater to the unique needs of retail and distribution customers. This approach allows businesses to foster stronger relationships, enhance market penetration, and customize pricing for individual and bulk purchases.
Event-Based Discounts. Tied to seasons, festivals, or specific occasions, event-based discounts introduce a time-sensitive element. This dynamic enables businesses to align pricing strategies with the pulse of the market during specific periods, providing the agility to respond effectively to changing market dynamics.
4. Distribution Channels
Industries operating through multiple distribution channels, involving layers like manufacturers, distributors, and retailers, face unique challenges in devising pricing strategies. Each channel requires tailored pricing structures to address the distinct needs of intermediaries and end customers. This complexity is heightened without a unified pricing management system, making navigating and managing diverse pricing models effectively challenging. This disparity necessitates centralized control for effective management, especially considering the underlying thread of inventory that ties everything together.
5. Regulatory Challenges
Companies in sectors like healthcare, finance, or pharmaceuticals are bound by stringent regulations that significantly influence pricing strategies. Regulatory requirements may demand transparency in pricing, impose controls on pricing structures, or mandate compliance with specific pricing guidelines. Navigating these regulatory intricacies while maintaining competitive pricing adds complexity for businesses. As businesses strive for a unified and consistent pricing approach, navigating the regulatory landscape becomes critical to successful ERP pricing implementation.
6. Source of Truth
Ensuring a seamless ERP pricing implementation hinges on having a single, authoritative source of truth for pricing data. The ERP system emerges as this bedrock, embodying the most current and accurate pricing information. An architectural approach is often advocated that minimizes manual touches and ensures the fewest number of interactions. The crux lies in understanding the internal implications and how the architecture aligns with customer needs.
Despite potential organizational resistance, establishing the ERP as the unambiguous source of truth is the key to internal and external satisfaction. The critical role of the ERP system in pricing integration is magnified, particularly in contrast to the pitfalls of relying on third-party systems or maintaining pricing information in disparate locations. This narrative reinforces the need for a centralized control mechanism, emphasizing the ERP as the linchpin for consistent and accurate pricing across diverse channels.
7. Data Silos
A critical factor demanding attention is the emergence of data silos when utilizing pricing software or external tools, especially in contexts involving dynamic pricing or intricate formulas. A centralized source of truth is of utmost importance to prevent the potential pitfalls of neglecting consistent auditing within the ERP. The pricing information residing in various channels such as published pricing in the market, ERP-configured pricing, and e-commerce pricing, introduces challenges in maintaining consistency and accuracy, particularly when dealing with repeat orders from different channels.
8. Complexity of CPQ
Integrating CPQ systems requires extensive product details, customer information, and pricing data. Notably, sales and marketing teams resist direct engagement with ERP systems for quoting, further complicating the integration process. The inherent complexity of CPQ systems demands meticulous integration work, creating two-way loops within the ERP architecture. This further underscores the critical importance of addressing the challenges posed by CPQ integration to ensure a streamlined and efficient ERP implementation.
Some of these complexities involve data inconsistencies, the need to handle things externally, and the importance of having a structured pricing process. While there may be differences in opinions regarding the integration’s feasibility, the consensus is that maintaining a clear master-slave relationship, with the ERP system being the master, can help ensure successful ERP pricing implementation.
9. Two-way Integration
The criticality of seamless connectivity between CPQ systems and ERP involves a sophisticated two-way data flow mechanism where pricing details undergo dynamic changes based on evolving product configurations and customer requirements. Failure to consistently audit and manually check the ERP system introduces a cascade of problems, with a specific example illustrating challenges related to published pricing, ERP-configured pricing, and e-commerce pricing. The complexity arises when determining how to price an order, depending on the channel through which the opportunity is initiated. This manual process can lead to discrepancies, especially in repeat orders, creating a compelling argument for centralizing data within the ERP system.
10. Purchase Price
Navigating the landscape of ERP pricing implementation involves not only addressing pricing complexities on the sales side but also delving into the often-overlooked realm of the purchase price. The interconnected nature of the buying and selling sides of the business is often emphasized, stressing the importance of aligning these aspects to ensure overall consistency and efficiency. This advocates for a centralized control system within the ERP, despite potential challenges in getting the entire organization on the same page. It argues that treating the ERP as the source of truth for pricing data, even when residing in different channels, leads to better internal and external service in the long run.
+
ERP Implementation Failure Recovery
Learn how Frederick Wildman struggled with Microsoft Dynamics 365 ERP implementation failure even after spending over $5M and what options they had for recovery.
In conclusion, the blog stresses the need for businesses to address the challenges of ERP pricing implementation and advocates for centralized pricing data to mitigate these challenges. It emphasizes the impact of discounting forms, the intricacies of managing distribution channels, and the influence of regulatory requirements on pricing strategies. The central theme revolves around establishing the ERP system as the authoritative source of truth for pricing data. Despite potential resistance, the blog asserts that making the ERP the linchpin for consistent and accurate pricing across diverse channels is vital for internal and external satisfaction. It advocates for a centralized control mechanism within the ERP, underscoring its critical role in successful pricing integration.
Moreover, if you are contemplating ERP pricing implementation, it is essential to consider the factors that may impact your outcomes in the future. Understanding the dynamics of pricing and discounting adds another layer of insight to inform this decision-making process. Armed with this knowledge, you’ll be better equipped to engage in a meaningful and informed discussion with independent ERP consultants who serve as subject matter experts in this field. Collaborating with experienced ERP consultants becomes a strategic step in optimizing your pricing strategies and fostering a streamlined integration that stands the test of time.
FAQs
Why is it crucial to streamline and simplify the product portfolio during pricing integration with ERP systems?
Managing a diverse product range introduces complexities in pricing structures, potentially leading to confusion for customers. Streamlining the product portfolio simplifies pricing, enhances customer experience, and ensures consistency across channels.
How does understanding pricing dynamics contribute to effective pricing integration with ERP systems?
Pricing dynamics, including base pricing, warehouse-based pricing, customer-based pricing, and event-based pricing, influence the cost structure and strategies employed by businesses. Understanding these dynamics enables businesses to configure ERP systems effectively, ensuring accurate and consistent pricing data.
Why is the ERP system emphasized as the ‘source of truth’ for pricing data during integration, and how does it enhance internal and external satisfaction?
The ERP system serves as the authoritative source of pricing data, minimizing manual touches and ensuring consistency. Centralizing data within the ERP promotes accuracy, efficiency, and overall satisfaction internally and externally, aligning diverse channels and facilitating a streamlined integration process.
FREE RESOURCE
2025 Digital Transformation Report
This digital transformation report summarizes our annual research on ERP and digital transformation trends and forecasts for the year 2025.